![]()
![]()
![]()
The information collected by the  JICOSH
  ,
the former international center of JISHA, is available here, though it has not been updated:
,
the former international center of JISHA, is available here, though it has not been updated:
 Relation between extraordinary rate (%) of result of periodical medical examination in 2021 and average male life expectancy (2015) in each prefecture in Japan
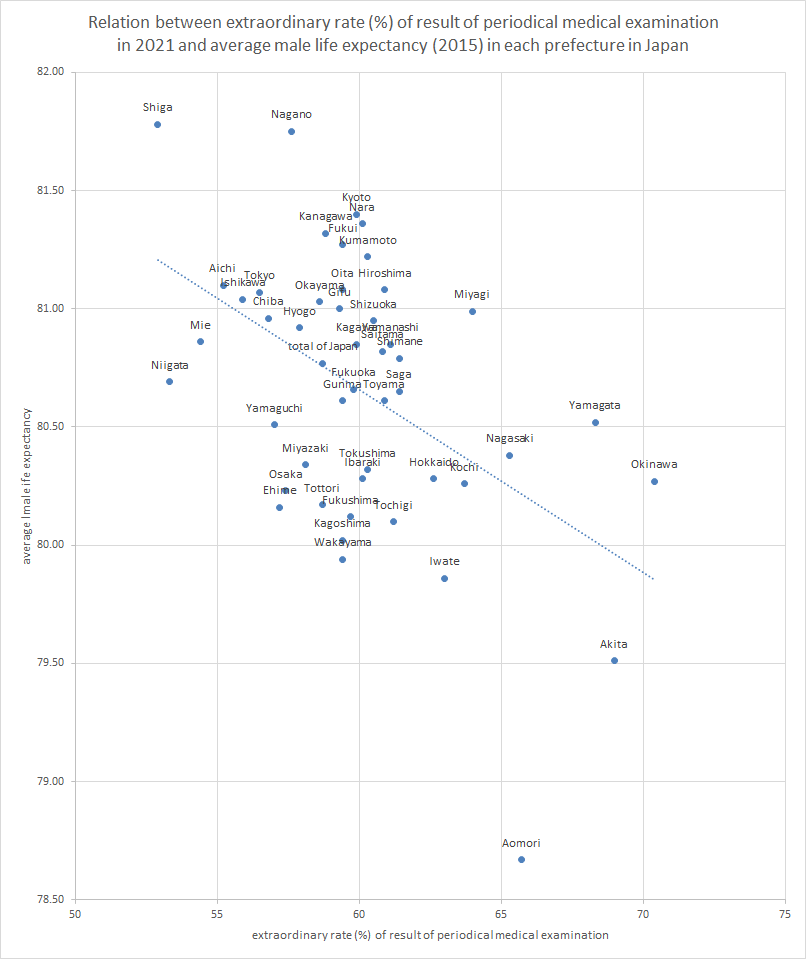
(unit:%)
| prefecture | extraordinary rate (%) of result of periodical medical examination | average male life expectancy | |
|---|---|---|---|
| 1 | Hokkaido | 62.6 | 80.28 |
| 2 | Aomori | 65.7 | 78.67 |
| 3 | Iwate | 63 | 79.86 |
| 4 | Miyagi | 64 | 80.99 |
| 5 | Akita | 69 | 79.51 |
| 6 | Yamagata | 68.3 | 80.52 |
| 7 | Fukushima | 59.7 | 80.12 |
| 8 | Ibaraki | 60.1 | 80.28 |
| 9 | Tochigi | 61.2 | 80.1 |
| 10 | Gunma | 59.4 | 80.61 |
| 11 | Saitama | 60.8 | 80.82 |
| 12 | Chiba | 56.8 | 80.96 |
| 13 | Tokyo | 56.5 | 81.07 |
| 14 | Kanagawa | 58.8 | 81.32 |
| 15 | Niigata | 53.3 | 80.69 |
| 16 | Toyama | 60.9 | 80.61 |
| 17 | Ishikawa | 55.9 | 81.04 |
| 18 | Fukui | 59.4 | 81.27 |
| 19 | Yamanashi | 61.1 | 80.85 |
| 20 | Nagano | 57.6 | 81.75 |
| 21 | Gifu | 59.3 | 81 |
| 22 | Shizuoka | 60.5 | 80.95 |
| 23 | Aichi | 55.2 | 81.1 |
| 24 | Mie | 54.4 | 80.86 |
| 25 | Shiga | 52.9 | 81.78 |
| 26 | Kyoto | 59.9 | 81.4 |
| 27 | Osaka | 57.4 | 80.23 |
| 28 | Hyogo | 57.9 | 80.92 |
| 29 | Nara | 60.1 | 81.36 |
| 30 | Wakayama | 59.4 | 79.94 |
| 31 | Tottori | 58.7 | 80.17 |
| 32 | Shimane | 61.4 | 80.79 |
| 33 | Okayama | 58.6 | 81.03 |
| 34 | Hiroshima | 60.9 | 81.08 |
| 35 | Yamaguchi | 57 | 80.51 |
| 36 | Tokushima | 60.3 | 80.32 |
| 37 | Kagawa | 59.9 | 80.85 |
| 38 | Ehime | 57.2 | 80.16 |
| 39 | Kochi | 63.7 | 80.26 |
| 40 | Fukuoka | 59.8 | 80.66 |
| 41 | Saga | 61.4 | 80.65 |
| 42 | Nagasaki | 65.3 | 80.38 |
| 43 | Kumamoto | 60.3 | 81.22 |
| 44 | Oita | 59.4 | 81.08 |
| 45 | Miyazaki | 58.1 | 80.34 |
| 46 | Kagoshima | 59.4 | 80.02 |
| 47 | Okinawa | 70.4 | 80.27 |
| 48 | total of Japan | 58.7 | 80.77 |
https://www.mhlw.go.jp/stf/newpage_09976.html https://www.mhlw.go.jp/toukei/saikin/hw/life/tdfk15/dl/tdfk15-02.pdfTransition of extraordinary rate (%) of result of periodical medical examination in Japan (1994-2021)
 全ての働く人々に安全・健康を 〜Safe Work , Safe Life〜
中央労働災害防止協会
〒108-0014 東京都港区芝5-35-2 安全衛生総合会館
COPYRIGHT © JISHA. ALLRIGHTS RESERVED.


