![]()
![]()
![]()
The information collected by the  JICOSH
  ,
the former international center of JISHA, is available here, though it has not been updated:
,
the former international center of JISHA, is available here, though it has not been updated:
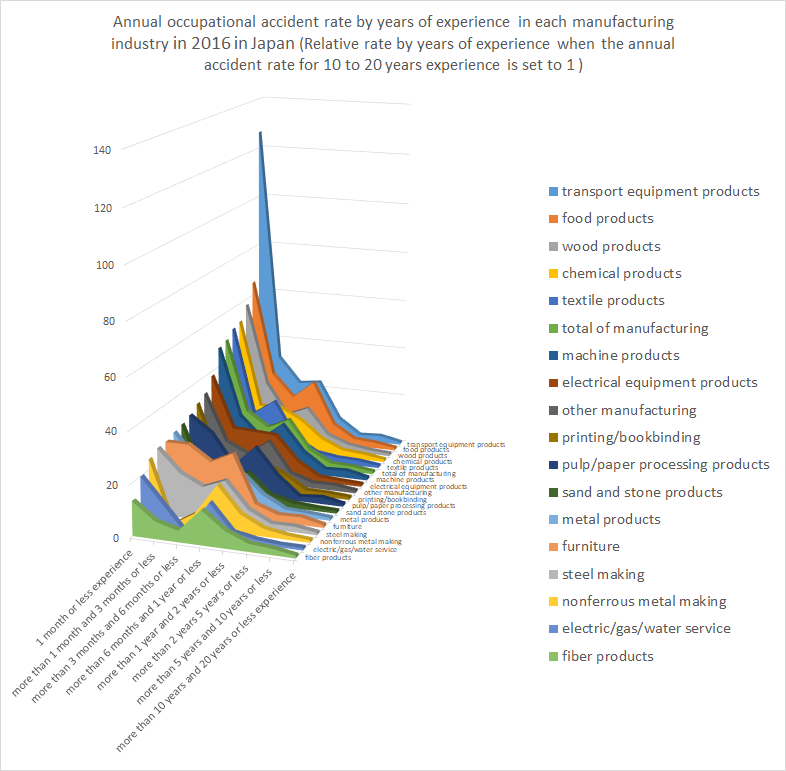
 Annual occupational accident rate by years of experience in each manufacturing industry in 2016 in Japan (Relative rate by years of experience when the annual accident rate for 10 to 20 years' experience is set to 1)
| industry | total | 1 month or less experience | more than 1 month and 3 months or less | more than 3 months and 6 months or less | more than 6 months and 1 year or less | more than 1 year and 2 years or less | more than 2 years 5 years or less | more than 5 years and 10 years or less | more than 10 years and 20 years or less | more than 20 years' experience | unclassifiable |
|---|---|---|---|---|---|---|---|---|---|---|---|
| total of manufacturing | 27,884 | 1,712 | 1,420 | 1,524 | 3,900 | 2,920 | 4,112 | 4,372 | 4,224 | 3,700 | 0 |
| food products | 8,660 | 640 | 532 | 532 | 1,480 | 964 | 1,352 | 1,348 | 1,176 | 636 | 0 |
| textile products | 340 | 24 | 16 | 32 | 24 | 20 | 52 | 56 | 56 | 60 | 0 |
| fiber products | 232 | 4 | 4 | 4 | 24 | 24 | 44 | 44 | 36 | 48 | 0 |
| wood products | 1,288 | 96 | 84 | 64 | 164 | 120 | 224 | 160 | 200 | 176 | 0 |
| furniture | 492 | 12 | 24 | 28 | 68 | 32 | 60 | 84 | 56 | 128 | 0 |
| pulp/paper processing products | 780 | 28 | 44 | 32 | 112 | 104 | 84 | 148 | 116 | 112 | 0 |
| printing/bookbinding | 476 | 24 | 12 | 20 | 48 | 64 | 64 | 72 | 92 | 80 | 0 |
| chemical products | 2,116 | 140 | 96 | 144 | 216 | 212 | 376 | 360 | 320 | 252 | 0 |
| sand and stone products | 1,224 | 60 | 32 | 52 | 152 | 104 | 196 | 164 | 260 | 204 | 0 |
| steel making | 640 | 24 | 32 | 36 | 92 | 72 | 92 | 124 | 112 | 56 | 0 |
| nonferrous metal making | 368 | 12 | 0 | 8 | 52 | 44 | 72 | 48 | 60 | 72 | 0 |
| metal products | 4,260 | 160 | 200 | 204 | 516 | 472 | 608 | 608 | 712 | 780 | 0 |
| machine products | 1,692 | 84 | 72 | 64 | 200 | 180 | 216 | 308 | 212 | 356 | 0 |
| electrical equipment products | 1,028 | 56 | 52 | 76 | 148 | 128 | 132 | 124 | 176 | 136 | 0 |
| transport equipment products | 1,884 | 236 | 120 | 124 | 260 | 184 | 208 | 308 | 224 | 220 | 0 |
| electric/gas/water service | 128 | 4 | 4 | 0 | 16 | 8 | 16 | 12 | 24 | 44 | 0 |
| other manufacturing | 2,276 | 108 | 96 | 104 | 328 | 188 | 316 | 404 | 392 | 340 | 0 |
 https://anzeninfo.mhlw.go.jp/user/anzen/tok/link/tok1-701-5.xlsx(MHLW, Japan)
| experience | 1 month or less experience | more than 1 month and 3 months or less | more than 3 months and 6 months or less | more than 6 months and 1 year or less | more than 1 year and 2 years or less | more than 2 years 5 years or less | more than 5 years and 10 years or less | more than 10 years and 20 years or less experience |
|---|---|---|---|---|---|---|---|---|
| conversion factor for annual rate | 12 | 6 | 4 | 2 | 1 | 0.25 | 0.2 | 0.1 |
| total of manufacturing | 48.6 | 20.2 | 14.4 | 18.5 | 6.9 | 2.4 | 2.1 | 1 |
| food products | 65.3 | 27.1 | 18.1 | 25.2 | 8.2 | 2.9 | 2.3 | 1 |
| textile products | 51.4 | 17.1 | 22.9 | 8.6 | 3.6 | 2.3 | 2 | 1 |
| fiber products | 13.3 | 6.7 | 4.4 | 13.3 | 6.7 | 3.1 | 2.4 | 1 |
| wood products | 57.6 | 25.2 | 12.8 | 16.4 | 6 | 2.8 | 1.6 | 1 |
| furniture | 25.7 | 25.7 | 20 | 24.3 | 5.7 | 2.7 | 3 | 1 |
| pulp/paper processing products | 29 | 22.8 | 11 | 19.3 | 9 | 1.8 | 2.6 | 1 |
| printing/bookbinding | 31.3 | 7.8 | 8.7 | 10.4 | 7 | 1.7 | 1.6 | 1 |
| chemical products | 52.5 | 18 | 18 | 13.5 | 6.6 | 2.9 | 2.2 | 1 |
| sand and stone products | 27.7 | 7.4 | 8 | 11.7 | 4 | 1.9 | 1.3 | 1 |
| steel making | 25.7 | 17.1 | 12.9 | 16.4 | 6.4 | 2.1 | 2.2 | 1 |
| nonferrous metal making | 24 | 0 | 5.3 | 17.3 | 7.3 | 3 | 1.6 | 1 |
| metal products | 27 | 16.9 | 11.5 | 14.5 | 6.6 | 2.1 | 1.7 | 1 |
| machine products | 47.5 | 20.4 | 12.1 | 18.9 | 8.5 | 2.5 | 2.9 | 1 |
| electrical equipment products | 38.2 | 17.7 | 17.3 | 16.8 | 7.3 | 1.9 | 1.4 | 1 |
| transport equipment products | 126.4 | 32.1 | 22.1 | 23.2 | 8.2 | 2.3 | 2.8 | 1 |
| electric/gas/water service | 20 | 10 | 0 | 13.3 | 3.3 | 1.7 | 1 | 1 |
| other manufacturing | 33.1 | 14.7 | 10.6 | 16.7 | 4.8 | 2 | 2.1 | 1 |
全ての働く人々に安全・健康を 〜Safe Work , Safe Life〜
中央労働災害防止協会
〒108-0014 東京都港区芝5-35-2 安全衛生総合会館
COPYRIGHT © JISHA. ALLRIGHTS RESERVED.


