![]()
![]()
![]()
The information collected by the  JICOSH
  ,
the former international center of JISHA, is available here, though it has not been updated:
,
the former international center of JISHA, is available here, though it has not been updated:
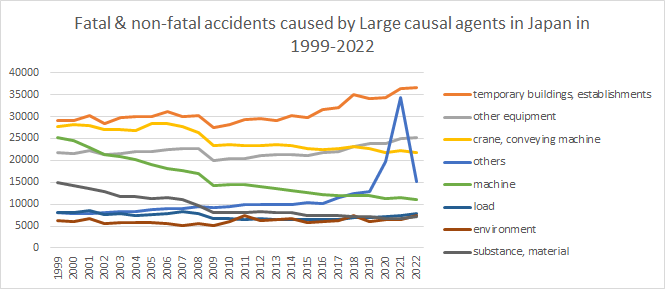
 Fatal & non-fatal accidents caused by Large causal agents in Japan in 1999-2022
 | Causal (L) agents | 1999 | 2000 | 2001 | 2002 | 2003 | 2004 | 2005 | 2006 | 2007 | 2008 | 2009 | 2010 | 2011 | 2012 | 2013 | 2014 | 2015 | 2016 | 2017 | 2018 | 2019 | 2020 | 2021 | 2022 | total | Causal (L) agents |
|---|---|---|---|---|---|---|---|---|---|---|---|---|---|---|---|---|---|---|---|---|---|---|---|---|---|---|
| machine | 25,149 | 24,466 | 22,905 | 21,440 | 20,971 | 20,132 | 19,027 | 18,188 | 17,723 | 16,950 | 14,347 | 14,418 | 14,462 | 14,039 | 13,474 | 13,106 | 12,649 | 12,191 | 12,014 | 11,929 | 11,908 | 11,268 | 11,472 | 11,140 | 385,368 | machine |
| crane, conveying machine | 27,703 | 28,227 | 27,961 | 26,939 | 27,092 | 26,804 | 28,513 | 28,370 | 27,643 | 26,454 | 23,289 | 23,632 | 23,297 | 23,472 | 23,573 | 23,407 | 22,644 | 22,459 | 22,792 | 23,250 | 22,711 | 21,673 | 22,343 | 21,810 | 596,058 | crane, conveying machine |
| other equipment | 21,772 | 21,618 | 22,293 | 21,363 | 21,448 | 21,927 | 22,012 | 22,383 | 22,655 | 22,695 | 19,862 | 20,401 | 20,501 | 21,157 | 21,256 | 21,392 | 21,041 | 21,782 | 22,049 | 23,061 | 23,861 | 23,738 | 24,884 | 25,208 | 530,359 | other equipment |
| temporary buildings, establishments | 29,140 | 29,142 | 30,124 | 28,388 | 29,723 | 29,998 | 30,100 | 31,227 | 29,973 | 30,333 | 27,500 | 28,276 | 29,357 | 29,633 | 28,999 | 30,285 | 29,885 | 31,608 | 32,105 | 35,123 | 34,068 | 34,443 | 36,307 | 36,716 | 742,453 | temporary buildings, establishments |
| substance, material | 14,831 | 14,351 | 13,664 | 12,769 | 11,840 | 11,771 | 11,263 | 11,414 | 10,945 | 9,687 | 8,076 | 8,080 | 8,155 | 8,316 | 8,044 | 8,141 | 7,473 | 7,319 | 7,390 | 7,260 | 7,204 | 6,647 | 6,665 | 7,065 | 228,370 | substance, material |
| load | 8,008 | 8,170 | 8,653 | 7,697 | 7,790 | 7,435 | 7,543 | 7,940 | 8,286 | 7,829 | 6,692 | 6,599 | 6,537 | 6,669 | 6,460 | 6,408 | 6,456 | 6,554 | 6,530 | 6,910 | 7,042 | 7,272 | 7,392 | 7,770 | 174,642 | load |
| environment | 6,264 | 6,088 | 6,737 | 5,681 | 5,774 | 5,877 | 5,855 | 5,682 | 5,216 | 5,535 | 5,181 | 5,939 | 7,487 | 6,346 | 6,498 | 6,792 | 5,704 | 5,942 | 6,169 | 7,445 | 5,950 | 6,388 | 6,432 | 7,418 | 148,400 | environment |
| others | 8,188 | 7,912 | 7,812 | 8,062 | 8,298 | 8,304 | 8,737 | 9,094 | 9,037 | 9,543 | 9,205 | 9,388 | 9,826 | 9,944 | 9,853 | 10,004 | 10,459 | 10,055 | 11,411 | 12,351 | 12,867 | 19,727 | 34,423 | 15,228 | 269,728 | others |
| total | 141,055 | 139,974 | 140,149 | 132,339 | 132,936 | 132,248 | 133,050 | 134,298 | 131,478 | 129,026 | 114,152 | 116,733 | 119,622 | 119,576 | 118,157 | 119,535 | 116,311 | 117,910 | 120,460 | 127,329 | 125,611 | 131,156 | 149,918 | 132,355 | 3,075,378 | total |
Fatal and non-fatal accidents mean fatal and non-fatal injuries and occupational diseases with work absence of 4 days and more.
Data of 2022 year do not include Covid-19 cases. Data of 2020 & 2021 year include Covid-19 cases. Fatal and non-fatal data are same situation.
Data of 2011 year include fatal and non-fatal accidents caused by Great East Japan Earthquake in 2011.
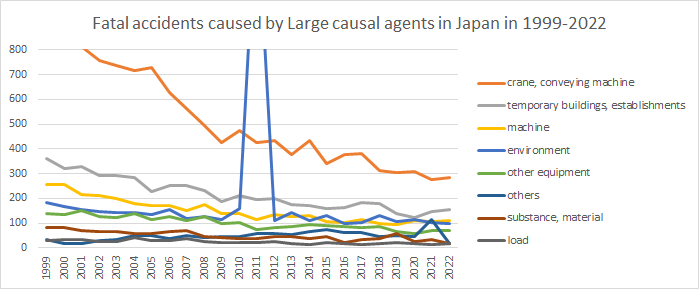
| Causal (L) agents | 1999 | 2000 | 2001 | 2002 | 2003 | 2004 | 2005 | 2006 | 2007 | 2008 | 2009 | 2010 | 2011 | 2012 | 2013 | 2014 | 2015 | 2016 | 2017 | 2018 | 2019 | 2020 | 2021 | 2022 | total | Causal (L) agents |
|---|---|---|---|---|---|---|---|---|---|---|---|---|---|---|---|---|---|---|---|---|---|---|---|---|---|---|
| machine | 256 | 256 | 217 | 212 | 200 | 180 | 170 | 171 | 153 | 175 | 139 | 138 | 116 | 133 | 126 | 129 | 106 | 103 | 116 | 99 | 95 | 111 | 107 | 110 | 3,618 | machine |
| crane, conveying machine | 909 | 876 | 815 | 757 | 738 | 717 | 728 | 627 | 565 | 494 | 424 | 474 | 425 | 434 | 378 | 433 | 340 | 378 | 380 | 314 | 306 | 308 | 275 | 285 | 12,380 | crane, conveying machine |
| other equipment | 138 | 136 | 151 | 125 | 122 | 140 | 115 | 126 | 110 | 127 | 98 | 104 | 73 | 84 | 87 | 96 | 91 | 86 | 83 | 85 | 66 | 58 | 71 | 72 | 2,444 | other equipment |
| temporary buildings, establishments | 360 | 320 | 327 | 293 | 294 | 284 | 226 | 254 | 251 | 232 | 189 | 213 | 196 | 201 | 177 | 172 | 161 | 163 | 184 | 179 | 140 | 121 | 147 | 157 | 5,241 | temporary buildings, establishments |
| substance, material | 81 | 83 | 72 | 66 | 67 | 59 | 58 | 67 | 72 | 45 | 44 | 39 | 38 | 46 | 48 | 36 | 48 | 20 | 33 | 37 | 58 | 26 | 35 | 17 | 1,195 | substance, material |
| load | 30 | 34 | 34 | 25 | 27 | 43 | 30 | 31 | 36 | 26 | 20 | 22 | 21 | 25 | 17 | 15 | 20 | 17 | 15 | 19 | 23 | 16 | 14 | 16 | 576 | load |
| environment | 184 | 168 | 156 | 149 | 145 | 145 | 135 | 157 | 119 | 128 | 114 | 158 | 1,409 | 110 | 142 | 110 | 130 | 100 | 103 | 129 | 105 | 115 | 103 | 99 | 4,413 | environment |
| others | 34 | 16 | 18 | 31 | 35 | 52 | 52 | 39 | 51 | 41 | 47 | 47 | 60 | 60 | 55 | 66 | 76 | 61 | 64 | 47 | 52 | 47 | 115 | 18 | 1,184 | others |
| total | 1,992 | 1,889 | 1,790 | 1,658 | 1,628 | 1,620 | 1,514 | 1,472 | 1,357 | 1,268 | 1,075 | 1,195 | 2,338 | 1,093 | 1,030 | 1,057 | 972 | 928 | 978 | 909 | 845 | 802 | 867 | 774 | 31,051 | total |
Data sources: https://anzeninfo.mhlw.go.jp/user/anzen/tok/anst00.htm (MHLW, Japan)
Reference:
全ての働く人々に安全・健康を 〜Safe Work , Safe Life〜
中央労働災害防止協会
〒108-0014 東京都港区芝5-35-2 安全衛生総合会館
COPYRIGHT © JISHA. ALLRIGHTS RESERVED.


