![]()
![]()
![]()
The information collected by the  JICOSH
  ,
the former international center of JISHA, is available here, though it has not been updated:
,
the former international center of JISHA, is available here, though it has not been updated:
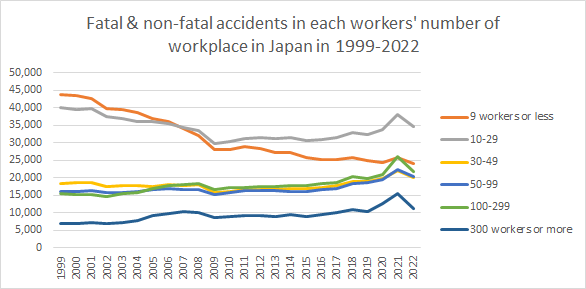
 Fatal & non-fatal accidents in each workers' number of workplace in Japan in 1999-2022
 | workers' number | 1999 | 2000 | 2001 | 2002 | 2003 | 2004 | 2005 | 2006 | 2007 | 2008 | 2009 | 2010 | 2011 | 2012 | 2013 | 2014 | 2015 | 2016 | 2017 | 2018 | 2019 | 2020 | 2021 | 2022 | total | workers' number |
|---|---|---|---|---|---|---|---|---|---|---|---|---|---|---|---|---|---|---|---|---|---|---|---|---|---|---|
| 9 workers or less | 43,888 | 43,532 | 42,524 | 39,861 | 39,412 | 38,579 | 36,864 | 35,940 | 34,000 | 32,098 | 28,133 | 28,145 | 28,819 | 28,296 | 27,302 | 27,207 | 25,670 | 25,106 | 25,163 | 25,755 | 25,021 | 24,466 | 25,852 | 24,165 | 755,798 | 9 workers or less |
| 10-29 | 40,126 | 39,543 | 39,844 | 37,394 | 36,799 | 36,161 | 35,965 | 35,595 | 34,362 | 33,481 | 29,788 | 30,509 | 31,276 | 31,454 | 31,225 | 31,638 | 30,602 | 30,938 | 31,563 | 32,871 | 32,472 | 33,689 | 37,982 | 34,656 | 819,933 | 10-29 |
| 30-49 | 18,386 | 18,634 | 18,662 | 17,632 | 17,929 | 17,929 | 17,625 | 18,204 | 17,902 | 18,099 | 15,774 | 16,092 | 16,590 | 16,777 | 16,705 | 17,059 | 16,903 | 17,213 | 17,872 | 19,084 | 19,096 | 19,733 | 22,109 | 20,120 | 432,129 | 30-49 |
| 50-99 | 16,222 | 16,166 | 16,501 | 15,749 | 15,944 | 16,142 | 16,555 | 17,021 | 16,753 | 16,679 | 15,201 | 15,789 | 16,302 | 16,294 | 16,267 | 16,239 | 16,231 | 16,647 | 17,059 | 18,451 | 18,666 | 19,563 | 22,511 | 20,355 | 409,307 | 50-99 |
| 100-299 | 15,560 | 15,112 | 15,341 | 14,720 | 15,515 | 15,759 | 16,905 | 17,821 | 18,137 | 18,472 | 16,544 | 17,214 | 17,349 | 17,399 | 17,642 | 17,918 | 17,822 | 18,349 | 18,650 | 20,241 | 19,865 | 21,063 | 26,068 | 21,717 | 431,183 | 100-299 |
| 300 workers or more | 6,873 | 6,987 | 7,277 | 6,983 | 7,337 | 7,678 | 9,136 | 9,717 | 10,324 | 10,197 | 8,712 | 8,984 | 9,286 | 9,356 | 9,016 | 9,474 | 9,083 | 9,657 | 10,153 | 10,927 | 10,491 | 12,642 | 15,396 | 11,342 | 227,028 | 300 workers or more |
| total | 141,055 | 139,974 | 140,149 | 132,339 | 132,936 | 132,248 | 133,050 | 134,298 | 131,478 | 129,026 | 114,152 | 116,733 | 119,622 | 119,576 | 118,157 | 119,535 | 116,311 | 117,910 | 120,460 | 127,329 | 125,611 | 131,156 | 149,918 | 132,355 | 3,075,378 | total |
Fatal and non-fatal accidents mean fatal and non-fatal injuries and occupational diseases with work absence of 4 days and more.
Data of 2022 year do not include Covid-19 cases. Data of 2020 & 2021 year include Covid-19 cases. Fatal and non-fatal data are same situation.
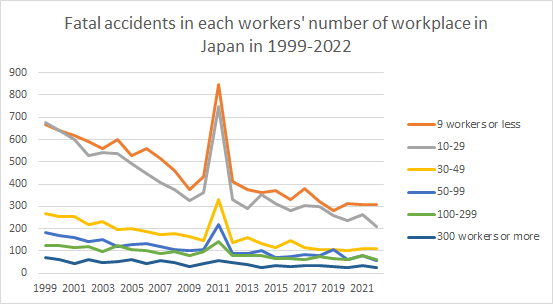
Data of 2011 year include fatal and non-fatal accidents caused by Great East Japan Earthquake in 2011.
| workers' number | 1999 | 2000 | 2001 | 2002 | 2003 | 2004 | 2005 | 2006 | 2007 | 2008 | 2009 | 2010 | 2011 | 2012 | 2013 | 2014 | 2015 | 2016 | 2017 | 2018 | 2019 | 2020 | 2021 | 2022 | total | workers' number |
| 9 workers or less | 666 | 639 | 617 | 590 | 560 | 600 | 529 | 560 | 514 | 462 | 376 | 436 | 847 | 411 | 376 | 364 | 373 | 331 | 380 | 321 | 281 | 313 | 306 | 308 | 11,160 | 9 workers or less |
| 10-29 | 678 | 641 | 601 | 529 | 540 | 535 | 493 | 449 | 408 | 376 | 326 | 364 | 748 | 331 | 289 | 351 | 312 | 281 | 304 | 297 | 260 | 237 | 261 | 210 | 9,821 | 10-29 |
| 30-49 | 269 | 253 | 256 | 217 | 230 | 194 | 202 | 186 | 174 | 177 | 165 | 147 | 330 | 137 | 160 | 133 | 114 | 148 | 115 | 106 | 105 | 103 | 111 | 110 | 4,142 | 30-49 |
| 50-99 | 182 | 170 | 160 | 140 | 153 | 118 | 127 | 132 | 120 | 108 | 100 | 105 | 216 | 88 | 86 | 102 | 72 | 75 | 83 | 80 | 105 | 62 | 79 | 58 | 2,721 | 50-99 |
| 100-299 | 126 | 126 | 114 | 120 | 98 | 122 | 104 | 101 | 86 | 97 | 80 | 98 | 142 | 80 | 80 | 80 | 67 | 65 | 62 | 73 | 66 | 60 | 78 | 62 | 2,187 | 100-299 |
| 300 workers or more | 71 | 60 | 42 | 62 | 47 | 51 | 59 | 44 | 55 | 48 | 28 | 45 | 55 | 46 | 39 | 27 | 34 | 28 | 34 | 32 | 28 | 27 | 32 | 26 | 1,020 | 300 workers or more |
| total | 1,992 | 1,889 | 1,790 | 1,658 | 1,628 | 1,620 | 1,514 | 1,472 | 1,357 | 1,268 | 1,075 | 1,195 | 2,338 | 1,093 | 1,030 | 1,057 | 972 | 928 | 978 | 909 | 845 | 802 | 867 | 774 | 31,051 | total |
Data sources: https://anzeninfo.mhlw.go.jp/user/anzen/tok/anst00.htm (MHLW, Japan)
Reference:
全ての働く人々に安全・健康を 〜Safe Work , Safe Life〜
中央労働災害防止協会
〒108-0014 東京都港区芝5-35-2 安全衛生総合会館
COPYRIGHT © JISHA. ALLRIGHTS RESERVED.


