![]()
![]()
![]()
The information collected by the  JICOSH
  ,
the former international center of JISHA, is available here, though it has not been updated:
,
the former international center of JISHA, is available here, though it has not been updated:
 Annual occupational accident rate by years of experience in construction industry in 2014 in Japan (Relative rate by years of experience when the annual accident rate for 1 to 2 years experience is set to 1 )
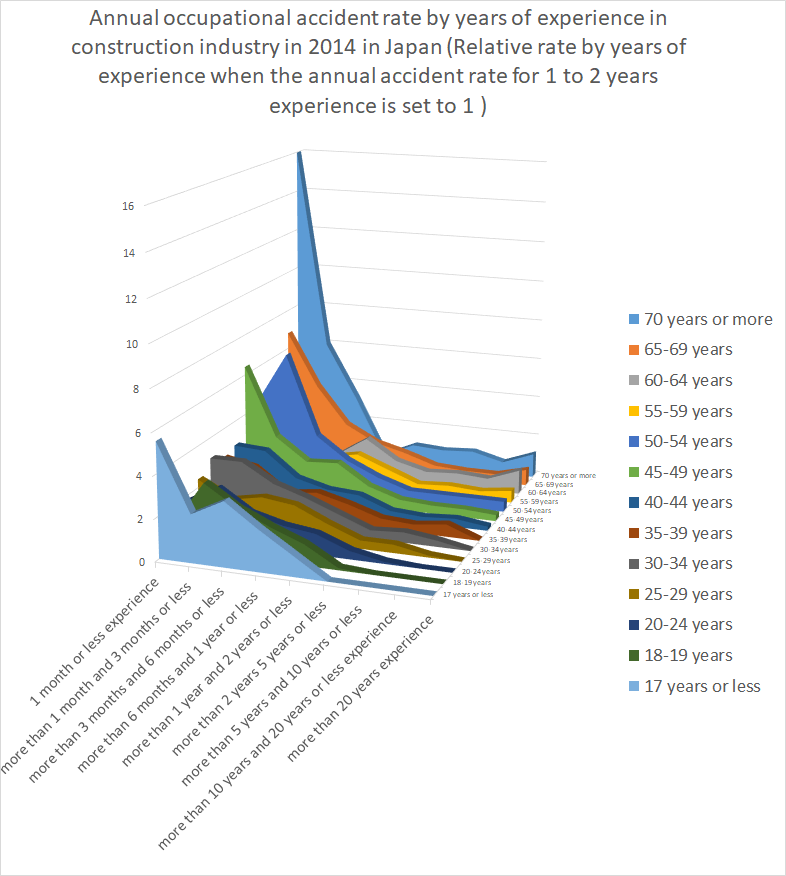
| age | total | 1 month or less experience | more than 1 month and 3 months or less | more than 3 months and 6 months or less | more than 6 months and 1 year or less | more than 1 year and 2 years or less | more than 2 years 5 years or less | more than 5 years and 10 years or less | more than 10 years and 20 years or less | more than 20 years experience | Unclassifiable |
|---|---|---|---|---|---|---|---|---|---|---|---|
| total | 6,057 | 125 | 228 | 217 | 355 | 475 | 764 | 783 | 1,252 | 1,855 | 3 |
| 17 years or less | 47 | 6 | 5 | 10 | 13 | 13 | 0 | 0 | 0 | 0 | 0 |
| 18-19 years | 138 | 4 | 23 | 24 | 33 | 42 | 12 | 0 | 0 | 0 | 0 |
| 20-24 years | 398 | 13 | 37 | 34 | 52 | 85 | 135 | 38 | 3 | 1 | 0 |
| 25-29 years | 442 | 13 | 18 | 32 | 55 | 66 | 104 | 119 | 34 | 0 | 1 |
| 30-34 years | 571 | 13 | 26 | 27 | 41 | 52 | 93 | 137 | 181 | 1 | 0 |
| 35-39 years | 606 | 10 | 18 | 14 | 32 | 47 | 86 | 94 | 270 | 34 | 1 |
| 40-44 years | 637 | 11 | 21 | 18 | 26 | 47 | 74 | 69 | 196 | 175 | 0 |
| 45-49 years | 538 | 16 | 15 | 14 | 30 | 30 | 62 | 66 | 127 | 177 | 1 |
| 50-54 years | 522 | 8 | 26 | 16 | 19 | 23 | 48 | 59 | 111 | 212 | 0 |
| 55-59 years | 634 | 7 | 14 | 9 | 21 | 27 | 45 | 67 | 105 | 339 | 0 |
| 60-64 years | 805 | 7 | 8 | 5 | 21 | 21 | 49 | 69 | 116 | 509 | 0 |
| 65-69 years | 464 | 9 | 11 | 9 | 11 | 16 | 34 | 35 | 72 | 267 | 0 |
| 70 years or more | 255 | 8 | 6 | 5 | 1 | 6 | 22 | 30 | 37 | 140 | 0 |
 https://anzeninfo.mhlw.go.jp/user/anzen/tok/link/tok1-699-3-2.xlsx(MHLW, Japan)
| experience | 1 month or less experience | more than 1 month and 3 months or less | more than 3 months and 6 months or less | more than 6 months and 1 year or less | more than 1 year and 2 years or less | more than 2 years 5 years or less | more than 5 years and 10 years or less | more than 10 years and 20 years or less | more than 20 years experience |
|---|---|---|---|---|---|---|---|---|---|
| conversion factor for annual rate | 12 | 6 | 4 | 2 | 1 | 0.25 | 0.2 | 0.1 | 0.05 |
| 17 years or less | 5.5 | 2.3 | 3.1 | 2 | 1 | 0 | 0 | 0 | 0 |
| 18-19 years | 1.1 | 3.3 | 2.3 | 1.6 | 1 | 0.1 | 0 | 0 | 0 |
| 20-24 years | 1.8 | 2.6 | 1.6 | 1.2 | 1 | 0.4 | 0.1 | 0 | 0 |
| 25-29 years | 2.4 | 1.6 | 1.9 | 1.7 | 1 | 0.4 | 0.4 | 0.1 | 0 |
| 30-34 years | 3 | 3 | 2.1 | 1.6 | 1 | 0.4 | 0.5 | 0.3 | 0 |
| 35-39 years | 2.6 | 2.3 | 1.2 | 1.4 | 1 | 0.5 | 0.4 | 0.6 | 0 |
| 40-44 years | 2.8 | 2.7 | 1.5 | 1.1 | 1 | 0.4 | 0.3 | 0.4 | 0.2 |
| 45-49 years | 6.4 | 3 | 1.9 | 2 | 1 | 0.5 | 0.4 | 0.4 | 0.3 |
| 50-54 years | 4.2 | 6.8 | 2.8 | 1.7 | 1 | 0.5 | 0.5 | 0.5 | 0.5 |
| 55-59 years | 3.1 | 3.1 | 1.3 | 1.6 | 1 | 0.4 | 0.5 | 0.4 | 0.6 |
| 60-64 years | 4 | 2.3 | 1 | 2 | 1 | 0.6 | 0.7 | 0.6 | 1.2 |
| 65-69 years | 6.8 | 4.1 | 2.2 | 1.4 | 1 | 0.5 | 0.4 | 0.4 | 0.8 |
| 70 years or more | 16 | 6 | 3.3 | 0.3 | 1 | 0.9 | 1 | 0.6 | 1.2 |
全ての働く人々に安全・健康を 〜Safe Work , Safe Life〜
中央労働災害防止協会
〒108-0014 東京都港区芝5-35-2 安全衛生総合会館
COPYRIGHT © JISHA. ALLRIGHTS RESERVED.


