![]()
![]()
![]()
The information collected by the  JICOSH
  ,
the former international center of JISHA, is available here, though it has not been updated:
,
the former international center of JISHA, is available here, though it has not been updated:
 Annual occupational accident rate by years of experience in forestry in 2015 in Japan (Relative rate by years of experience when the annual accident rate for 6 monrhs to 1 year experience is set to 1 )
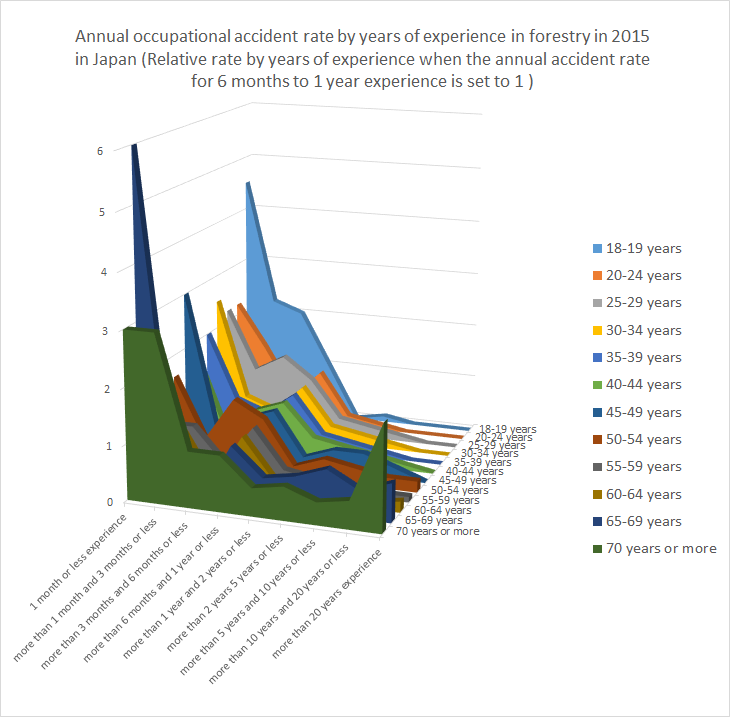
| experience | total | 1 month or less experience | more than 1 month and 3 months or less | more than 3 months and 6 months or less | more than 6 months and 1 year or less | more than 1 year and 2 years or less | more than 2 years 5 years or less | more than 5 years and 10 years or less | more than 10 years and 20 years or less | more than 20 years experience | Unclassifiable |
|---|---|---|---|---|---|---|---|---|---|---|---|
| total | 1,636 | 56 | 51 | 58 | 172 | 103 | 304 | 322 | 295 | 275 | 0 |
| 17 years or less | 1 | 0 | 0 | 1 | 0 | 0 | 0 | 0 | 0 | 0 | 0 |
| 18-19 years | 16 | 3 | 3 | 4 | 4 | 0 | 2 | 0 | 0 | 0 | 0 |
| 20-24 years | 66 | 7 | 9 | 5 | 19 | 7 | 19 | 0 | 0 | 0 | 0 |
| 25-29 years | 97 | 6 | 6 | 11 | 16 | 11 | 23 | 22 | 2 | 0 | 0 |
| 30-34 years | 149 | 11 | 6 | 7 | 26 | 17 | 33 | 37 | 12 | 0 | 0 |
| 35-39 years | 146 | 8 | 6 | 7 | 24 | 14 | 38 | 29 | 19 | 1 | 0 |
| 40-44 years | 176 | 5 | 2 | 7 | 18 | 15 | 40 | 45 | 37 | 7 | 0 |
| 45-49 years | 131 | 5 | 2 | 4 | 10 | 4 | 28 | 38 | 32 | 8 | 0 |
| 50-54 years | 157 | 3 | 2 | 7 | 11 | 5 | 31 | 28 | 37 | 33 | 0 |
| 55-59 years | 173 | 3 | 6 | 3 | 20 | 12 | 27 | 25 | 47 | 30 | 0 |
| 60-64 years | 240 | 0 | 6 | 1 | 18 | 12 | 33 | 60 | 49 | 61 | 0 |
| 65-69 years | 162 | 4 | 1 | 0 | 4 | 4 | 20 | 30 | 41 | 58 | 0 |
| 70 years or more | 122 | 1 | 2 | 1 | 2 | 2 | 10 | 8 | 19 | 77 | 0 |
| Unclassifiable | 0 | 0 | 0 | 0 | 0 | 0 | 0 | 0 | 0 | 0 | 0 |
 https://anzeninfo.mhlw.go.jp/user/anzen/tok/link/tok1-700-6-1.xlsx(MHLW, Japan)
| experience | 1 month or less experience | more than 1 month and 3 months or less | more than 3 months and 6 months or less | more than 6 months and 1 year or less | more than 1 year and 2 years or less | more than 2 years 5 years or less | more than 5 years and 10 years or less | more than 10 years and 20 years or less | more than 20 years experience |
|---|---|---|---|---|---|---|---|---|---|
| conversion factor for annual rate | 12 | 6 | 4 | 2 | 1 | 0.25 | 0.2 | 0.1 | 0.1 |
| 18-19 years | 4.5 | 2.2 | 2 | 1 | 0 | 0.1 | 0 | 0 | 0 |
| 20-24 years | 2.2 | 1.4 | 0.5 | 1 | 0.2 | 0.1 | 0 | 0 | 0 |
| 25-29 years | 2.2 | 1.1 | 1.4 | 1 | 0.3 | 0.2 | 0.1 | 0 | 0 |
| 30-34 years | 2.5 | 0.7 | 0.5 | 1 | 0.3 | 0.2 | 0.1 | 0 | 0 |
| 35-39 years | 2 | 0.8 | 0.6 | 1 | 0.3 | 0.2 | 0.1 | 0 | 0 |
| 40-44 years | 1.7 | 0.3 | 0.8 | 1 | 0.4 | 0.3 | 0.2 | 0.1 | 0 |
| 45-49 years | 3 | 0.6 | 0.8 | 1 | 0.2 | 0.4 | 0.4 | 0.2 | 0 |
| 50-54 years | 1.6 | 0.5 | 1.3 | 1 | 0.2 | 0.4 | 0.3 | 0.2 | 0.2 |
| 55-59 years | 0.9 | 0.9 | 0.3 | 1 | 0.3 | 0.2 | 0.1 | 0.1 | 0.1 |
| 60-64 years | 0 | 1 | 0.1 | 1 | 0.3 | 0.2 | 0.3 | 0.1 | 0.2 |
| 65-69 years | 6 | 0.8 | 0 | 1 | 0.5 | 0.6 | 0.8 | 0.5 | 0.7 |
| 70 years or more | 3 | 3 | 1 | 1 | 0.5 | 0.6 | 0.4 | 0.5 | 1.9 |
全ての働く人々に安全・健康を 〜Safe Work , Safe Life〜
中央労働災害防止協会
〒108-0014 東京都港区芝5-35-2 安全衛生総合会館
COPYRIGHT © JISHA. ALLRIGHTS RESERVED.


