![]()
![]()
![]()
The information collected by the  JICOSH
  ,
the former international center of JISHA, is available here, though it has not been updated:
,
the former international center of JISHA, is available here, though it has not been updated:
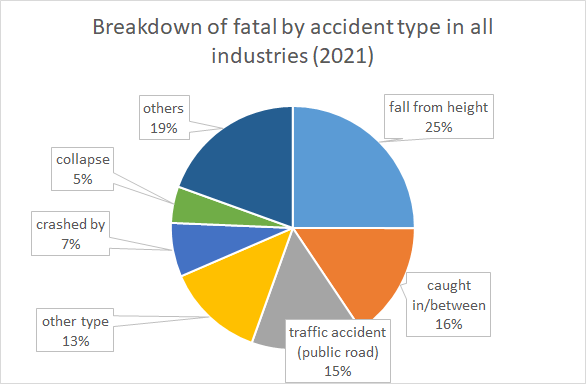
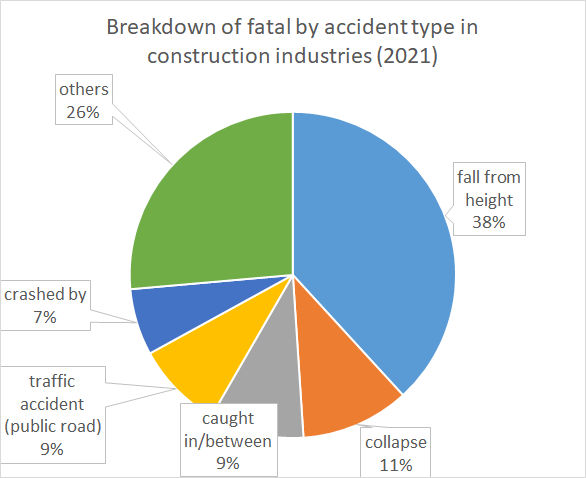
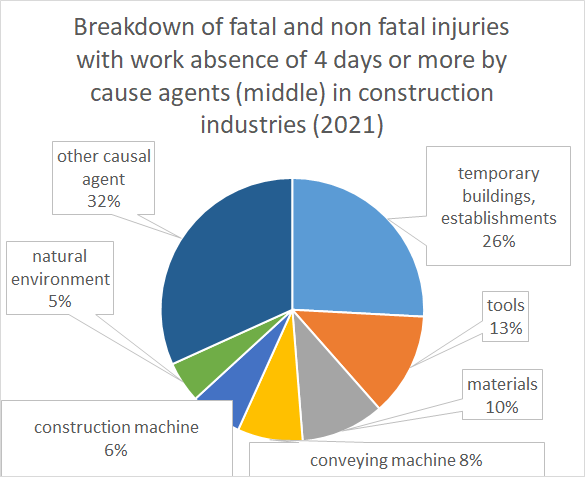
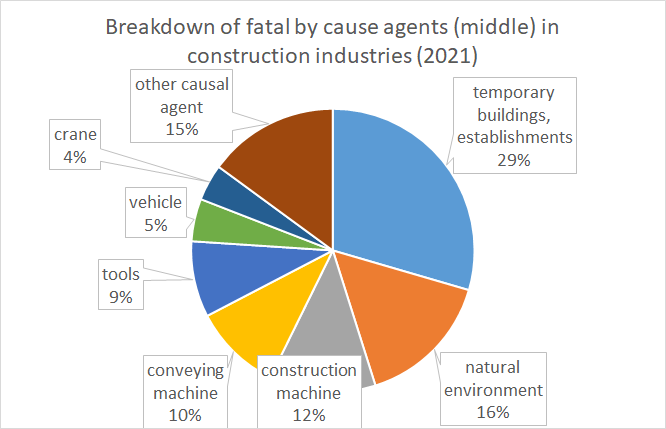
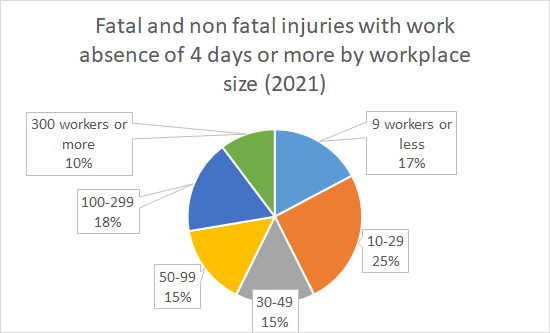
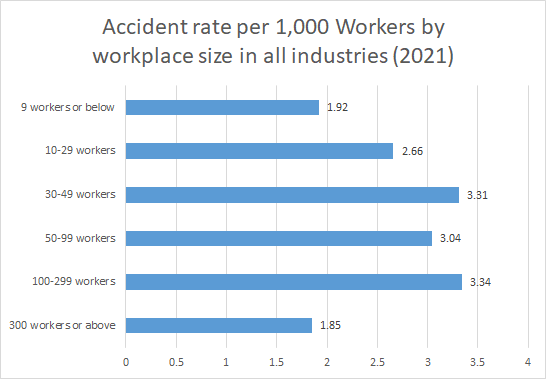
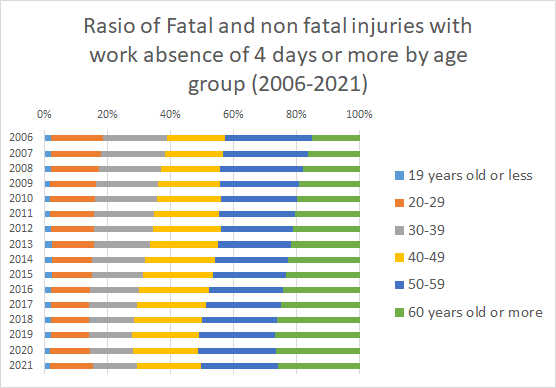
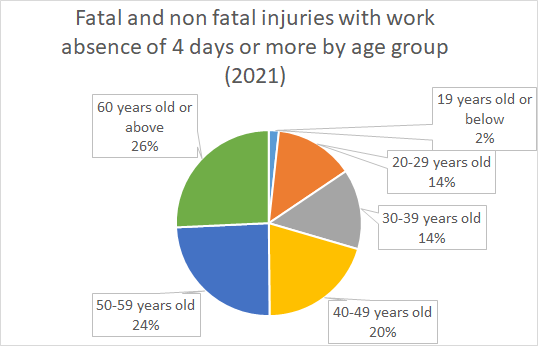
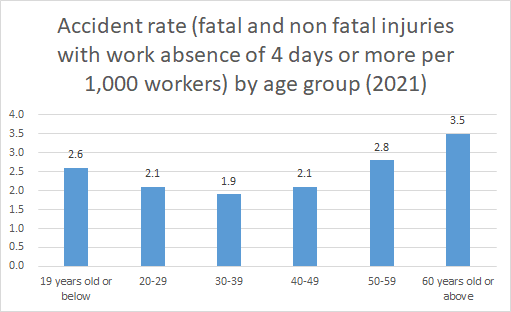
 Industrial Accidents Statistics in Japan (2021)
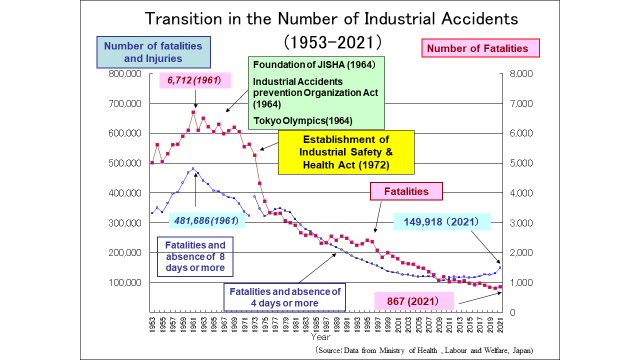
Survey by the Safety Division, Ministry of Health, Labour and Welfare (MHLW)https://www.jisha.or.jp/english/statistics/index.html
Survey by the Safety Division, Ministry of Health, Labour and Welfare (MHLW)https://www.jisha.or.jp/english/statistics/index.html
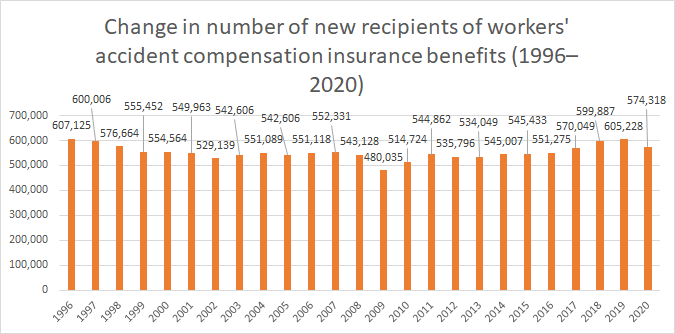
Number of new recipients of workers' accident compensation insurance benefits: Annual report on Workers' Accident Compensation Insurance Programme (only Japanese)
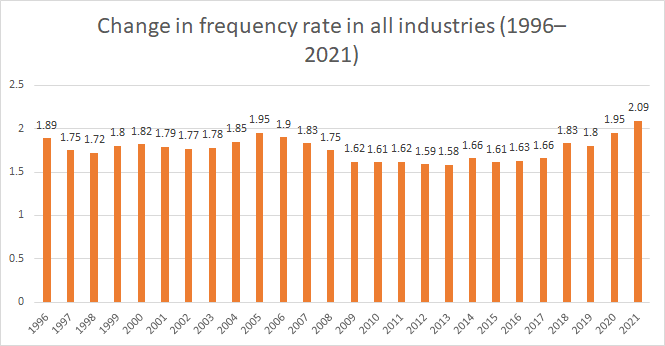
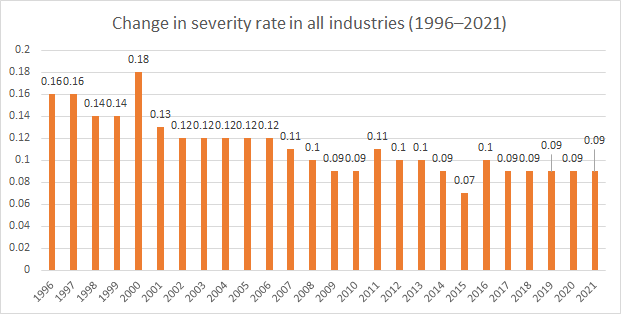
Frequency rate and severity rate: Industrial accident census, MHLW (only Japanese) 2021_ltifr.xls
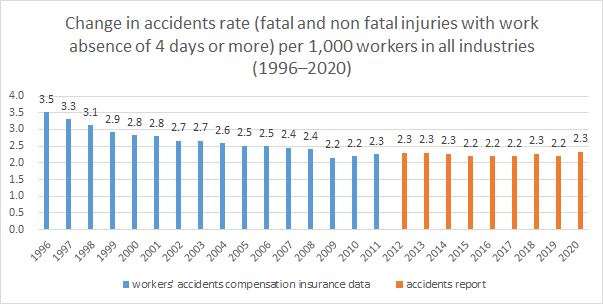
2020_accidents_rate.xls
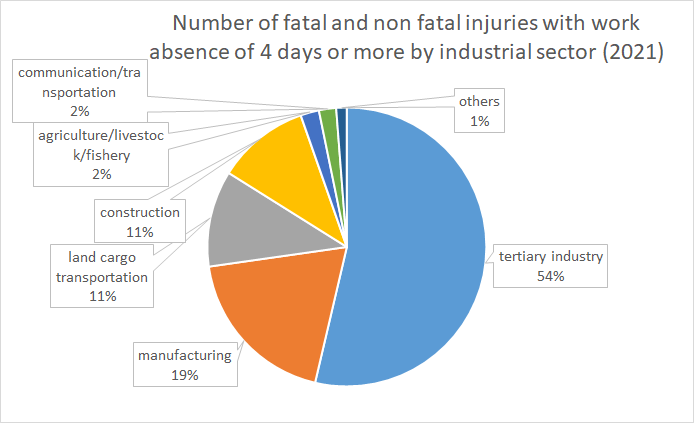
Industrial_accidents_in_2021.xls
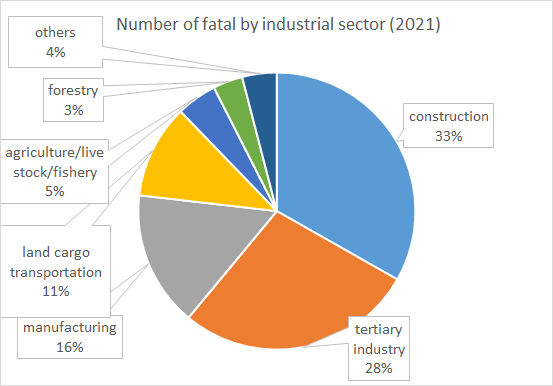
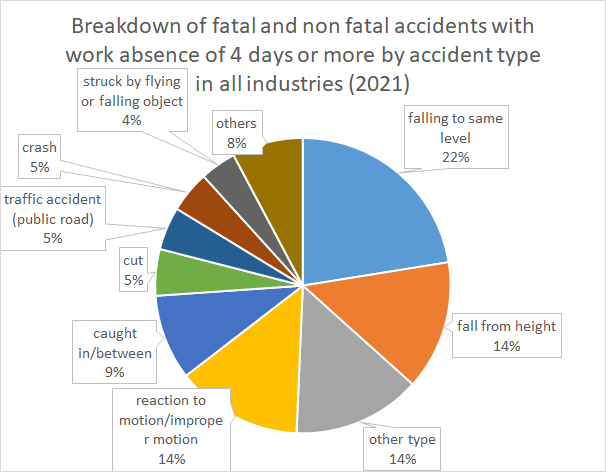
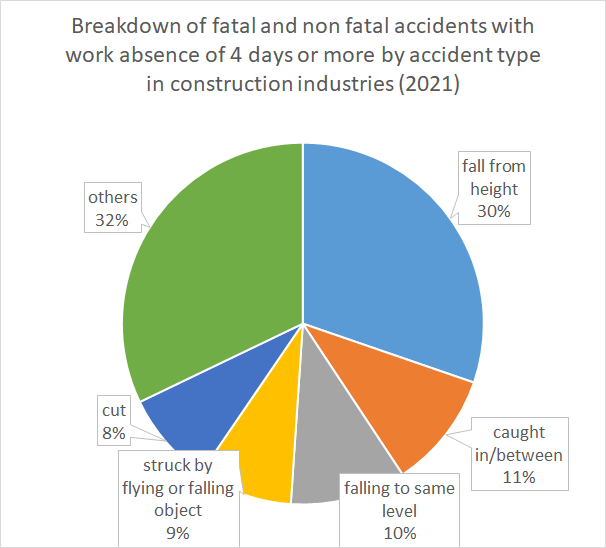
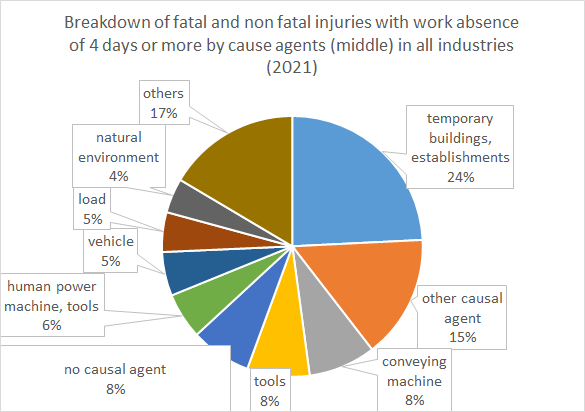
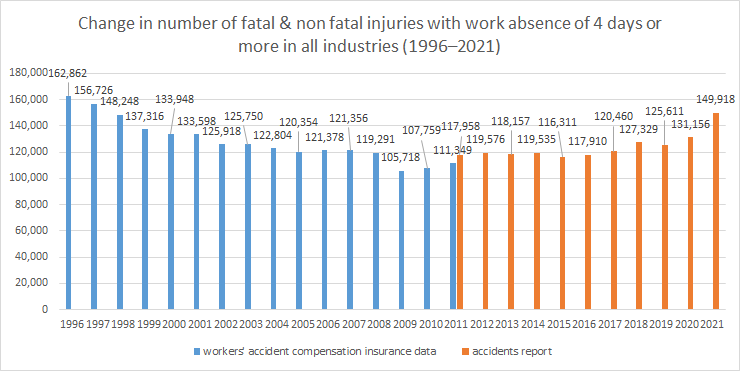
2021_accidents.xls
2021_accidents.xls
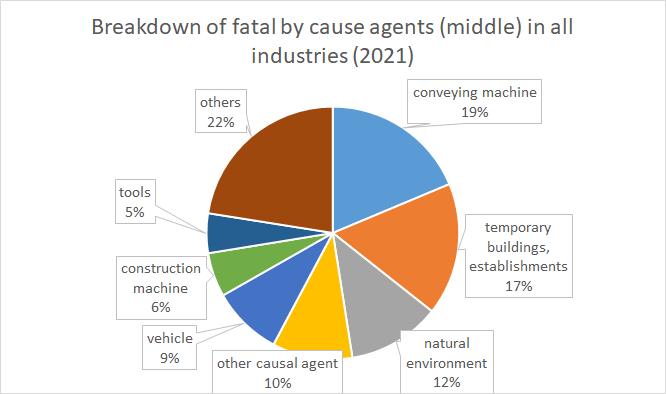
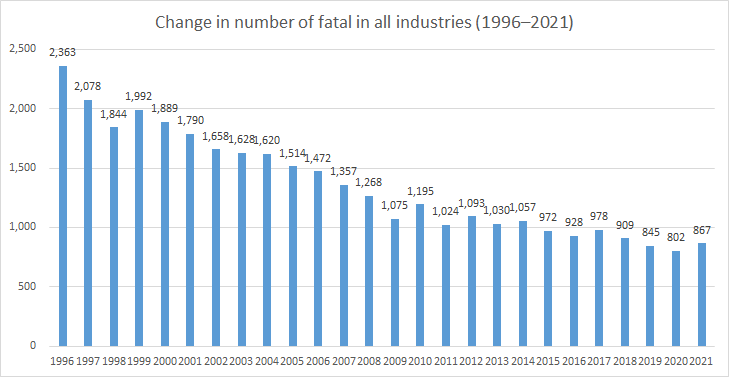
2021_fatal.xls
2021_fatal.xls
2021_accidents.xls
2021_accidents.xlsLabour Force Survey, Ministry of Internal Affairs and Communications (only Japanese)
全ての働く人々に安全・健康を 〜Safe Work , Safe Life〜
中央労働災害防止協会
〒108-0014 東京都港区芝5-35-2 安全衛生総合会館
COPYRIGHT © JISHA. ALLRIGHTS RESERVED.


