![]()
![]()
![]()
The information collected by the  JICOSH
  ,
the former international center of JISHA, is available here, though it has not been updated:
,
the former international center of JISHA, is available here, though it has not been updated:
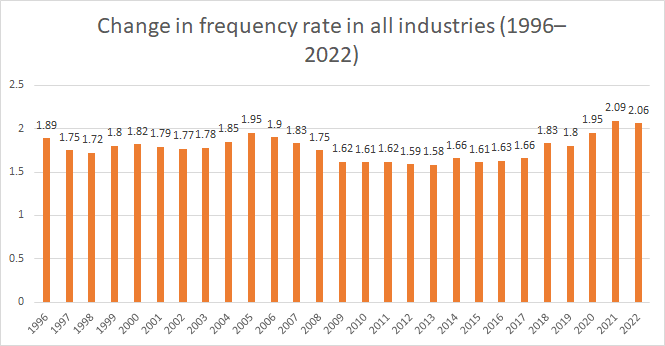
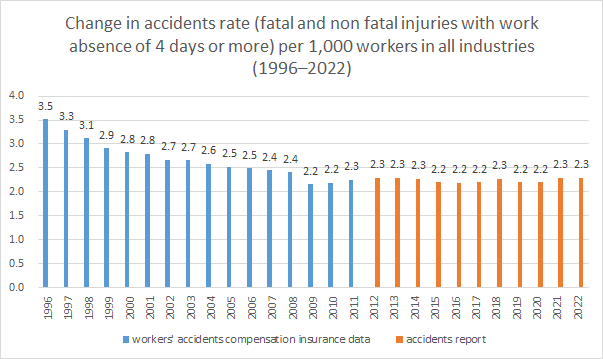
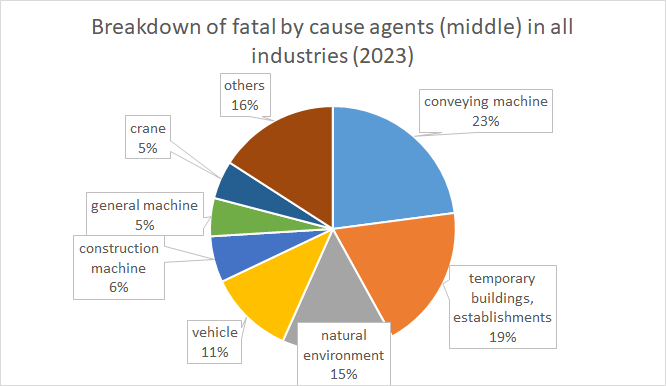
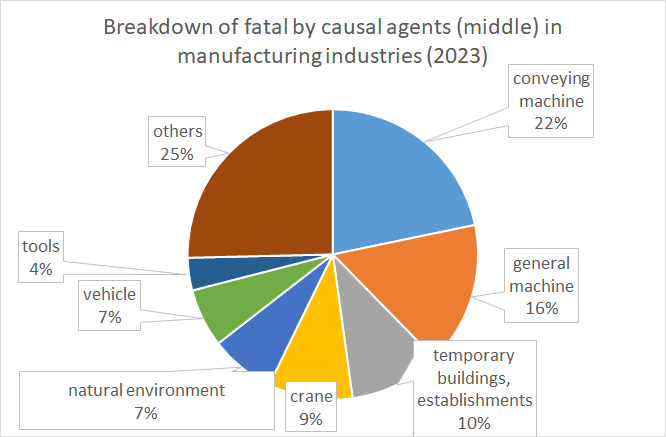
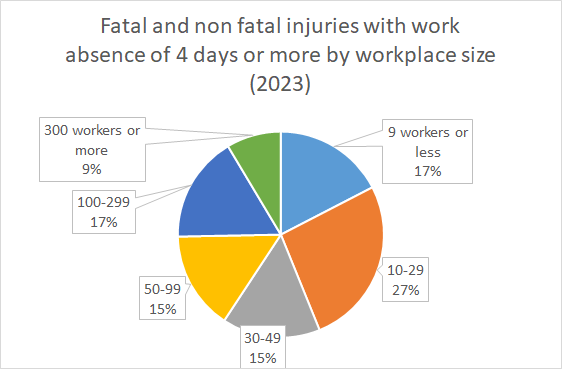
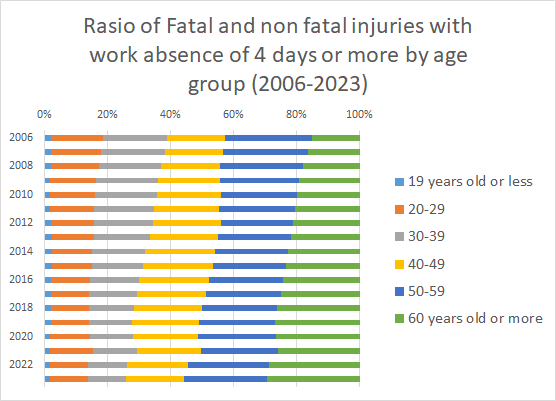
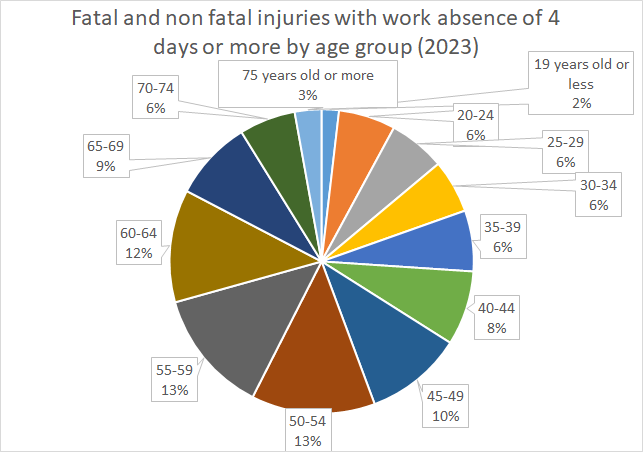
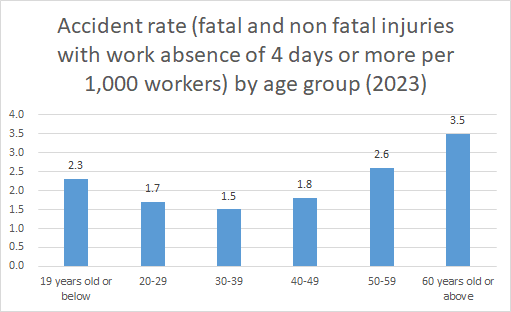
 Industrial Accidents Statistics in Japan (2022)
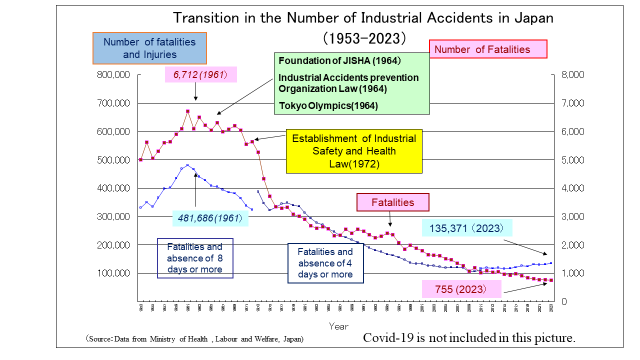
Survey by the Safety Division, Ministry of Health, Labour and Welfare (MHLW)https://www.jisha.or.jp/english/statistics/index.html
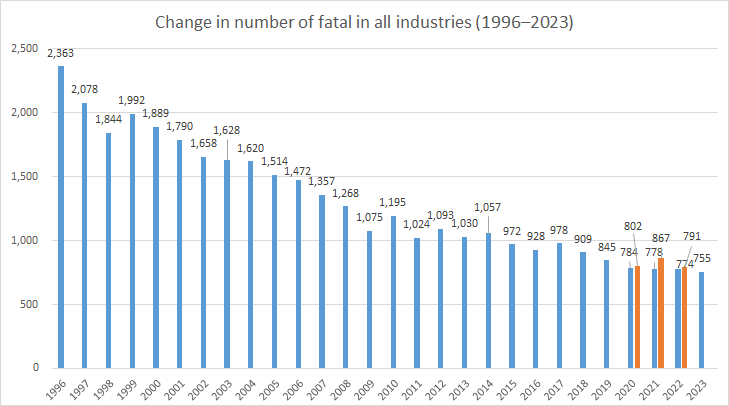
Orange lines in 2020-2022 include Covid-19 cases.
Blue lines in 2020-2023 do not include Covid-19 cases.
Survey by the Safety Division, Ministry of Health, Labour and Welfare (MHLW)https://www.jisha.or.jp/english/statistics/index.html
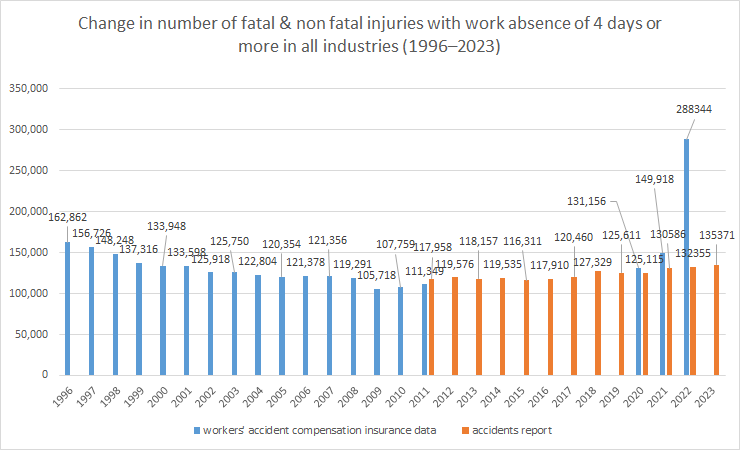
Blue lines in 2020-2022 include Covid-19 cases.
Orange lines in 2020-2023 do not include Covid-19 cases.


全ての働く人々に安全・健康を 〜Safe Work , Safe Life〜
中央労働災害防止協会
〒108-0014 東京都港区芝5-35-2 安全衛生総合会館
COPYRIGHT © JISHA. ALLRIGHTS RESERVED.


