![]()
![]()
![]()
The information collected by the  JICOSH
  ,
the former international center of JISHA, is available here, though it has not been updated:
,
the former international center of JISHA, is available here, though it has not been updated:
 Severity rate in Japan (1963-2022)
| 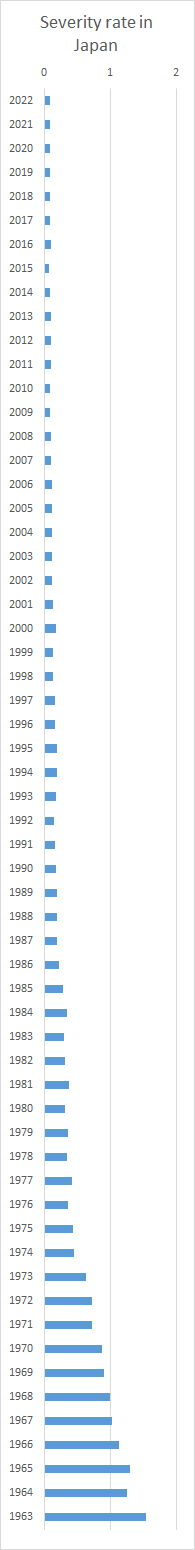 |
Note: 1) Due to the addition of "medical care and welfare" to the surveyed industries from 2008, the surveyed industries are not the same as those before 2007. Caution is needed in comparisons.
Note: 2) Due to the addition of "agriculture" in "agriculture and forestry" to the surveyed industries from 2011, the surveyed industries are not the same as those before 2010. Caution is needed in comparisons.
Note: 3) Due to the addition of "fisheries" to the surveyed industries from 2018, the surveyed industries are not the same as those before 2017. Caution is needed in comparisons.
Severity rate is expressed in terms of the number of workdays lost per 1,000 work-hours in the aggregate.
It indicates the degree of seriousness of the accident, calculated by the following formula :
| Severity rate | = | Aggregated number work-days lost / Total work-hours | ×1,000 |
Data sources: Survey on Industrial Accidents, Wage and Labour Welfare Statistics Office, Ministry of Health, Labour and Welfare, Japanhttps://www.mhlw.go.jp/toukei/itiran/roudou/saigai/22/ (Japanese only) https://www.mhlw.go.jp/english/database/db-l/industrial_accidents.html (English explanation, MHLW)
全ての働く人々に安全・健康を ~Safe Work , Safe Life~
中央労働災害防止協会
〒108-0014 東京都港区芝5-35-2 安全衛生総合会館
COPYRIGHT © JISHA. ALLRIGHTS RESERVED.


