![]()
![]()
![]()
The information collected by the  JICOSH
  ,
the former international center of JISHA, is available here, though it has not been updated:
,
the former international center of JISHA, is available here, though it has not been updated:
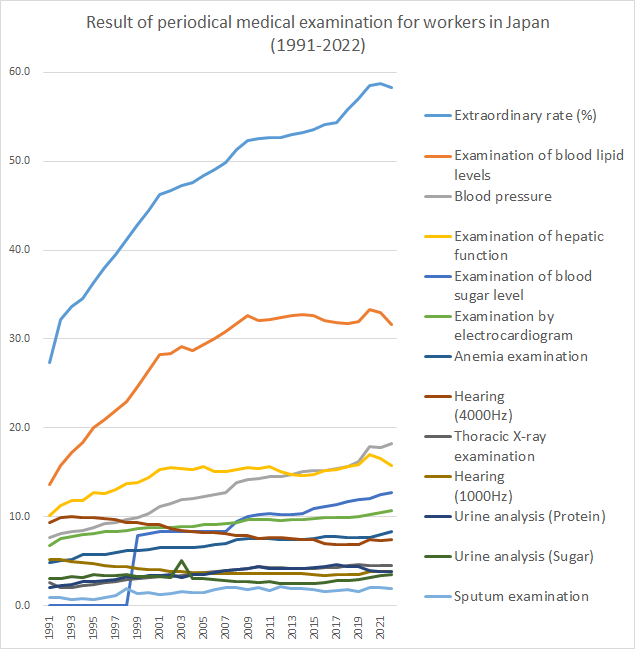
 Result of periodical medical examination for workers in Japan (1991-2022)
 | Hearing (1000Hz) | Hearing (4000Hz) | Thoracic X-ray examination | Sputum examination | Blood pressure | Anemia examination | Examination of hepatic function | Examination of blood lipid levels | Examination of blood sugar level | Urine analysis (Sugar) | Urine analysis (Protein) | Examination by electrocardiogram | Extraordinary rate (%) | |
|---|---|---|---|---|---|---|---|---|---|---|---|---|---|
| 1991 | 5.2 | 9.3 | 2.6 | 0.9 | 7.7 | 4.9 | 10.1 | 13.6 | - | 3.1 | 2.1 | 6.8 | 27.4 |
| 1992 | 5.2 | 9.9 | 2.1 | 0.9 | 8.1 | 5.1 | 11.3 | 15.8 | - | 3.1 | 2.3 | 7.6 | 32.2 |
| 1993 | 5 | 10 | 2.1 | 0.7 | 8.4 | 5.2 | 11.8 | 17.2 | - | 3.3 | 2.4 | 7.8 | 33.6 |
| 1994 | 4.9 | 9.9 | 2.3 | 0.8 | 8.5 | 5.8 | 11.8 | 18.3 | - | 3.2 | 2.7 | 8 | 34.6 |
| 1995 | 4.7 | 9.9 | 2.4 | 0.7 | 8.8 | 5.8 | 12.7 | 20 | - | 3.5 | 2.7 | 8.1 | 36.4 |
| 1996 | 4.5 | 9.8 | 2.6 | 0.9 | 9.2 | 5.8 | 12.6 | 20.9 | - | 3.4 | 2.8 | 8.3 | 38 |
| 1997 | 4.4 | 9.7 | 2.7 | 1.1 | 9.3 | 6 | 13.1 | 22 | - | 3.4 | 3 | 8.3 | 39.5 |
| 1998 | 4.4 | 9.4 | 2.9 | 1.9 | 9.7 | 6.2 | 13.7 | 23 | - | 3.5 | 3.3 | 8.5 | 41.2 |
| 1999 | 4.2 | 9.3 | 3.1 | 1.4 | 9.9 | 6.2 | 13.8 | 24.7 | 7.9 | 3.3 | 3.2 | 8.7 | 42.9 |
| 2000 | 4.1 | 9.1 | 3.2 | 1.5 | 10.4 | 6.3 | 14.4 | 26.5 | 8.1 | 3.3 | 3.4 | 8.8 | 44.5 |
| 2001 | 4.1 | 9.1 | 3.3 | 1.3 | 11.1 | 6.6 | 15.3 | 28.2 | 8.3 | 3.3 | 3.4 | 8.8 | 46.2 |
| 2002 | 3.9 | 8.7 | 3.3 | 1.4 | 11.5 | 6.6 | 15.5 | 28.4 | 8.3 | 3.2 | 3.5 | 8.8 | 46.7 |
| 2003 | 3.8 | 8.5 | 3.4 | 1.6 | 11.9 | 6.5 | 15.4 | 29.1 | 8.3 | 5.1 | 3.2 | 8.9 | 47.3 |
| 2004 | 3.7 | 8.4 | 3.6 | 1.5 | 12 | 6.6 | 15.3 | 28.7 | 8.3 | 3.1 | 3.5 | 8.9 | 47.6 |
| 2005 | 3.7 | 8.2 | 3.7 | 1.5 | 12.3 | 6.7 | 15.6 | 29.4 | 8.3 | 3.1 | 3.5 | 9.1 | 48.4 |
| 2006 | 3.6 | 8.2 | 3.9 | 1.8 | 12.5 | 6.9 | 15.1 | 30.1 | 8.4 | 2.9 | 3.7 | 9.1 | 49.1 |
| 2007 | 3.6 | 8.1 | 4 | 2 | 12.7 | 7 | 15.1 | 30.8 | 8.4 | 2.8 | 4 | 9.2 | 49.9 |
| 2008 | 3.6 | 7.9 | 4.1 | 2 | 13.8 | 7.4 | 15.3 | 31.7 | 9.5 | 2.7 | 4.1 | 9.3 | 51.3 |
| 2009 | 3.6 | 7.9 | 4.2 | 1.8 | 14.2 | 7.6 | 15.5 | 32.6 | 10 | 2.7 | 4.2 | 9.7 | 52.3 |
| 2010 | 3.6 | 7.6 | 4.4 | 2 | 14.3 | 7.6 | 15.4 | 32.1 | 10.3 | 2.6 | 4.4 | 9.7 | 52.5 |
| 2011 | 3.6 | 7.7 | 4.3 | 1.7 | 14.5 | 7.6 | 15.6 | 32.2 | 10.4 | 2.7 | 4.2 | 9.7 | 52.7 |
| 2012 | 3.6 | 7.7 | 4.3 | 2.2 | 14.5 | 7.4 | 15.1 | 32.4 | 10.2 | 2.5 | 4.2 | 9.6 | 52.7 |
| 2013 | 3.6 | 7.6 | 4.2 | 1.9 | 14.7 | 7.5 | 14.8 | 32.6 | 10.2 | 2.5 | 4.2 | 9.7 | 53 |
| 2014 | 3.6 | 7.5 | 4.2 | 1.9 | 15.1 | 7.4 | 14.6 | 32.7 | 10.4 | 2.5 | 4.2 | 9.7 | 53.2 |
| 2015 | 3.5 | 7.4 | 4.2 | 1.8 | 15.2 | 7.6 | 14.7 | 32.6 | 10.9 | 2.5 | 4.3 | 9.8 | 53.6 |
| 2016* | 3.4* | 7.0* | 4.3* | 1.6* | 15.2* | 7.8 | 15.2* | 32.1* | 11.1* | 2.6* | 4.4* | 9.9 | 54.1* |
| 2017* | 3.5* | 6.9* | 4.3* | 1.7* | 15.4* | 7.8 | 15.3* | 31.8* | 11.4 | 2.8 | 4.6* | 9.9 | 54.4* |
| 2018* | 3.5* | 6.9* | 4.5* | 1.8* | 15.7* | 7.7 | 15.7* | 31.7* | 11.7 | 2.8 | 4.4* | 9.9 | 55.8* |
| 2019 | 3.5 | 6.9 | 4.6 | 1.6 | 16.2 | 7.7 | 15.9 | 32 | 11.9 | 2.9 | 4.4 | 10 | 57 |
| 2020 | 3.9 | 7.4 | 4.5 | 2.1 | 17.9 | 7.7 | 17 | 33.3 | 12.1 | 3.2 | 4 | 10.3 | 58.5 |
| 2021 | 3.9 | 7.3 | 4.5 | 2.1 | 17.8 | 8 | 16.6 | 33 | 12.5 | 3.4 | 3.8 | 10.5 | 58.7 |
| 2022*2 | 3.9 | 7.4 | 4.5 | 1.9 | 18.2 | 8.3 | 15.8 | 31.6 | 12.7 | 3.5 | 3.8 | 10.7 | 58.3 |
MHLW has reviewed * mark data.
*2 : For 2022, the estimates are weighted averages of the prevalence rates before and after the October 2022 revision of the Occupational Safety and Health Regulations for each period.
Data mean extraordinary rate (%).
Source:
Reports of Result of periodical medical examination for workers in Japan by Ministry of Health, Labour and Welfare, Japan
Original Japanese data were writhen in Japanese:  https://www.mhlw.go.jp/content/11300000/001136600.xls
Translated by JISHA from Web site of Ministry of Health, Labour and Welfare, Japan
全ての働く人々に安全・健康を ~Safe Work , Safe Life~
中央労働災害防止協会
〒108-0014 東京都港区芝5-35-2 安全衛生総合会館
COPYRIGHT © JISHA. ALLRIGHTS RESERVED.


