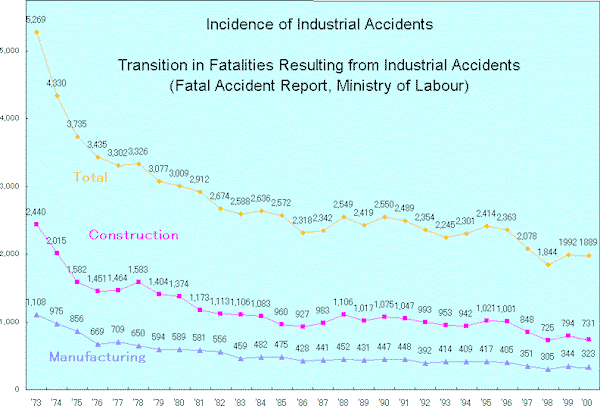
JICOSH Home > Statistics > Incidence of industrial accidents(number of fatalities, 1999ver, graph)
Incidence of Industrial Accidents

| Type of Business | ||||||||||||||||||
|---|---|---|---|---|---|---|---|---|---|---|---|---|---|---|---|---|---|---|
| % | % | % | % | % | % | % | % | % | ||||||||||
| 2000 (Jan.-Dec.) |
1889 | 100 | 323 | 17.1 | 323 | 1.4 | 731 | 38.7 | 29 | 1.5 | 271 | 14.3 | 11 | 0.6 | 53 | 2.8 | 445 | 23.6 |
| 1999 (Jan.-Dec.) |
1992 | 100 | 344 | 17.3 | 24 | 1.2 | 794 | 39.9 | 29 | 1.5 | 270 | 13.6 | 10 | 0.5 | 71 | 3.6 | 450 | 22.6 |
| 1998 (Jan.-Dec.) |
1844 | 100 | 305 | 16.5 | 29 | 1.6 | 725 | 39.3 | 47 | 2.5 | 225 | 12.2 | 19 | 1.0 | 69 | 3.7 | 425 | 23.0 |
| 1997 (Jan.-Dec.) |
2078 | 100 | 351 | 16.9 | 40 | 1.9 | 848 | 40.8 | 38 | 1.8 | 290 | 14 | 17 | 0.8 | 56 | 2.7 | 438 | 21.1 |
| 1996 (Jan.-Dec.) |
2363 | 100 | 405 | 17.1 | 32 | 1.4 | 1001 | 42.4 | 36 | 1.5 | 333 | 14.1 | 28 | 1.2 | 80 | 3.4 | 448 | 19.0 |
| 1995 (Jan.-Dec.) |
2414 | 100 | 417 | 17.3 | 45 | 1.9 | 1021 | 42.3 | 47 | 1.9 | 312 | 12.9 | 20 | 0.8 | 74 | 3.1 | 478 | 19.8 |
| 1994 (Jan.-Dec.) |
2301 | 100 | 409 | 17.8 | 27 | 1.2 | 942 | 40.9 | 47 | 2.0 | 292 | 12.7 | 15 | 0.7 | 83 | 3.6 | 486 | 21.1 |
| 1993 (Jan.-Dec.) |
2245 | 100 | 414 | 18.4 | 36 | 1.6 | 953 | 42.4 | 41 | 1.8 | 281 | 12.5 | 16 | 0.7 | 67 | 3.0 | 437 | 19.5 |
| 1992 (Jan.-Dec.) |
2354 | 100 | 392 | 16.7 | 41 | 1.7 | 993 | 42.2 | 47 | 2.0 | 270 | 11.5 | 22 | 0.9 | 88 | 3.7 | 501 | 21.3 |
| 1991 (Jan.-Dec.) |
2489 | 100 | 448 | 18.0 | 46 | 1.8 | 1047 | 42.1 | 52 | 2.1 | 292 | 11.7 | 29 | 1.2 | 81 | 3.3 | 494 | 19.8 |
| 1990 (Jan.-Dec.) |
2550 | 100 | 447 | 17.5 | 44 | 1.7 | 1075 | 42.2 | 64 | 2.5 | 311 | 12.2 | 28 | 1.1 | 89 | 3.5 | 492 | 19.3 |