JICOSH Home >
Statistics >
4. Occupational Diseases
| 4. Occupational Diseases (1) Trends in Occupational Diseases |
|
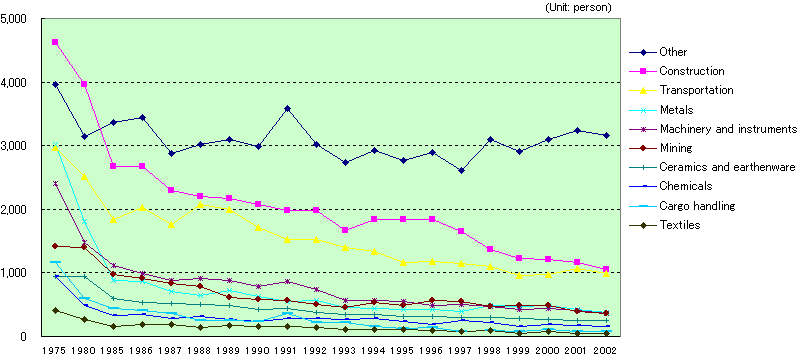
Fig. 23 Trends in the Number of Occupational Diseases by Industry (1975-2002) |

|
1975 | 1980 | 1985 | 1986 | 1987 | 1988 | 1989 | 1990 | 1991 | 1992 | 1993 | 1994 | 1995 | 1996 | 1997 | 1998 | 1999 | 2000 | 2001 | 2002 | ||
| Other | 3969 | 3147 | 3369 | 3445 | 2883 | 3023 | 3090 | 2989 | 3592 | 3016 | 2732 | 2919 | 2773 | 2888 | 2615 | 3098 | 2916 | 3101 | 3240 | 3164 | ||
| Construction | 4618 | 3965 | 2679 | 2677 | 2299 | 2197 | 2162 | 2078 | 1983 | 1982 | 1661 | 1846 | 1843 | 1834 | 1653 | 1364 | 1230 | 1216 | 1157 | 1055 | ||
| Transportation | 2975 | 2518 | 1835 | 2027 | 1757 | 2073 | 1998 | 1708 | 1523 | 1533 | 1400 | 1329 | 1157 | 1187 | 1143 | 1100 | 963 | 971 | 1062 | 998 | ||
| Metals | 3025 | 1811 | 881 | 870 | 715 | 648 | 725 | 624 | 553 | 564 | 451 | 439 | 418 | 427 | 388 | 490 | 465 | 489 | 428 | 377 | ||
| Machinery and instruments | 2409 | 1473 | 1110 | 988 | 878 | 913 | 880 | 785 | 872 | 734 | 572 | 560 | 543 | 490 | 498 | 470 | 418 | 445 | 405 | 364 | ||
| Mining | 1416 | 1394 | 974 | 909 | 831 | 789 | 615 | 583 | 572 | 507 | 462 | 539 | 482 | 572 | 543 | 468 | 490 | 480 | 386 | 359 | ||
| Ceramics and earthenware | 951 | 947 | 600 | 540 | 524 | 504 | 491 | 425 | 435 | 383 | 340 | 344 | 320 | 322 | 306 | 306 | 284 | 272 | 254 | 245 | ||
| Chemicals | 938 | 493 | 325 | 351 | 281 | 315 | 273 | 243 | 290 | 289 | 268 | 282 | 235 | 189 | 246 | 221 | 162 | 184 | 176 | 155 | ||
| Cargo handling | 1166 | 600 | 433 | 406 | 357 | 257 | 259 | 233 | 354 | 217 | 221 | 159 | 131 | 138 | 86 | 87 | 82 | 107 | 85 | 73 | ||
| Textiles | 413 | 263 | 162 | 182 | 184 | 145 | 176 | 163 | 156 | 134 | 114 | 106 | 113 | 92 | 72 | 87 | 52 | 71 | 50 | 52 |
INDEX |
- Home |
- Sitemap |
- Disclaimer
Copyright (C) 1999- JICOSH All Right Reserved.