JICOSH Home >
Statistics >
Occupational Injuries Caused by Press Machines
Comparison of Industrial Accidents Requiring
or Not Requiring Absences by Type of Industry
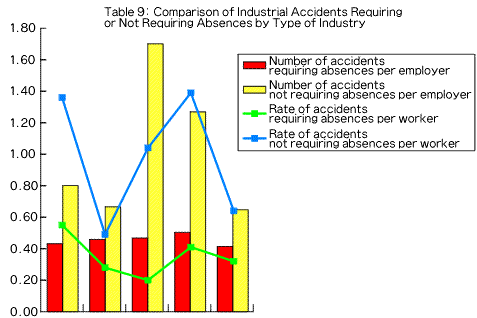
| Type of industry | Metal products manufacturing |
Electrical machine/ equipment manufacturing |
Transport machine/ equipment manufacturing |
General machine/ equipment manufacturing |
Other | |
| A1 | Number of accidents requiring absences (151) |
65 | 11 | 58 | 10 | 7 |
| A2 | Number of accidents not requiring absences (531) |
162 | 19 | 302 | 34 | 14 |
| B | Number of responding workplaces (505) |
236 | 35 | 179 | 28 | 27 |
| A1/B | Rate of accidents requiring absences per workplace (0.30 in average) |
0.28 | 0.31 | 0.32 | 0.36 | 0.26 |
| A2/B | Rate of accidents not requiring absences per workplace (1.05 in average) |
0.69 | 0.54 | 1.69 | 1.21 | 0.52 |
| Incidence of accidents requiring absences per worker (0.31 in average) |
0.55 | 0.28 | 0.20 | 0.41 | 0.32 | |
| Incidence of accidents not requiring absences per worker (1.08 in average) |
1.36 | 0.49 | 1.04 | 1.39 | 0.64 | |
- Home |
- Sitemap |
- Disclaimer
Copyright (C) 1999- JICOSH All Right Reserved.