![]()
![]()
![]()
The information collected by the  JICOSH
  ,
the former international center of JISHA, is available here, though it has not been updated:
,
the former international center of JISHA, is available here, though it has not been updated:
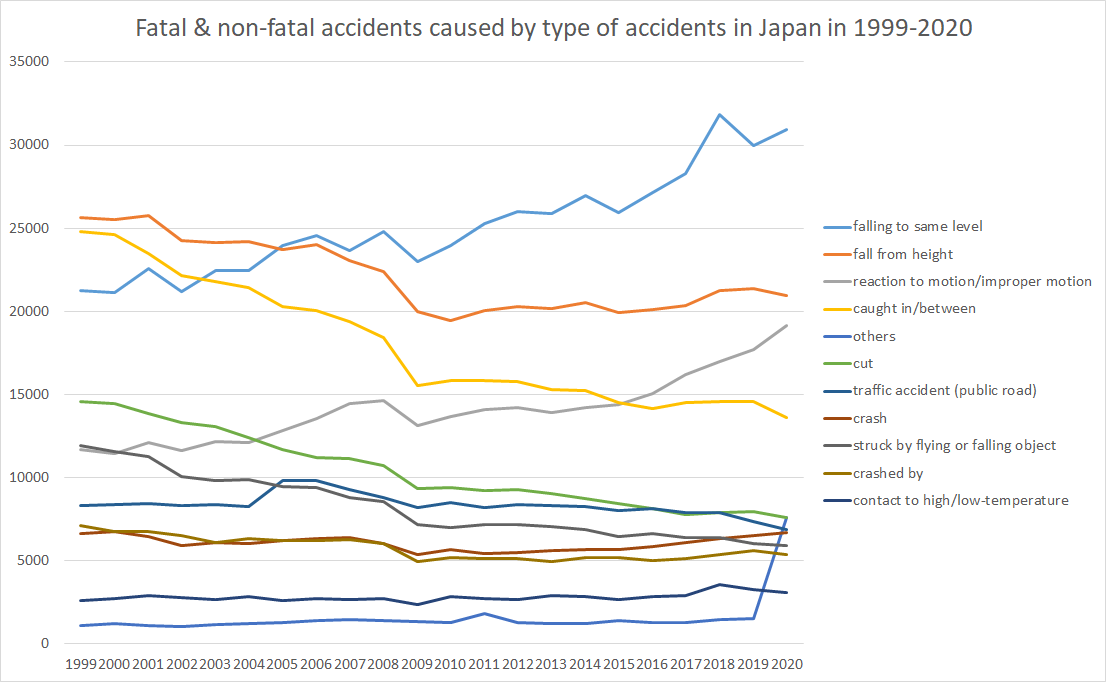
 Fatal & non-fatal accidents caused by type of accidents in Japan in 1999-2020
 | code | Type of accidents | 1999 | 2000 | 2001 | 2002 | 2003 | 2004 | 2005 | 2006 | 2007 | 2008 | 2009 | 2010 | 2011 | 2012 | 2013 | 2014 | 2015 | 2016 | 2017 | 2018 | 2019 | 2020 | code |
|---|---|---|---|---|---|---|---|---|---|---|---|---|---|---|---|---|---|---|---|---|---|---|---|---|
| 01 | fall from height | 25,627 | 25,507 | 25,762 | 24,262 | 24,118 | 24,193 | 23,730 | 24,029 | 23,064 | 22,379 | 20,006 | 19,458 | 20,051 | 20,275 | 20,182 | 20,551 | 19,906 | 20,094 | 20,374 | 21,221 | 21,346 | 20,977 |  fall from height fall from height |
| 02 | falling to same level | 21,228 | 21,105 | 22,591 | 21,204 | 22,474 | 22,456 | 23,963 | 24,549 | 23,649 | 24,792 | 23,002 | 23,958 | 25,305 | 25,974 | 25,878 | 26,982 | 25,949 | 27,152 | 28,310 | 31,833 | 29,986 | 30,929 | falling to same level |
| 03 | crash | 6,625 | 6,723 | 6,456 | 5,898 | 6,108 | 6,038 | 6,215 | 6,316 | 6,372 | 6,019 | 5,342 | 5,674 | 5,406 | 5,499 | 5,596 | 5,667 | 5,659 | 5,861 | 6,111 | 6,354 | 6,534 | 6,669 | crash |
| 04 | struck by flying or falling object | 11,916 | 11,557 | 11,241 | 10,046 | 9,828 | 9,874 | 9,448 | 9,367 | 8,769 | 8,552 | 7,150 | 6,998 | 7,189 | 7,192 | 7,035 | 6,843 | 6,467 | 6,600 | 6,376 | 6,410 | 6,049 | 5,912 | struck by flying or falling object |
| 05 | collapse | 3,395 | 3,478 | 3,378 | 3,180 | 3,172 | 3,107 | 2,999 | 3,120 | 3,042 | 2,859 | 2,429 | 2,464 | 2,356 | 2,388 | 2,391 | 2,334 | 2,259 | 2,261 | 2,212 | 2,312 | 2,236 | 2,057 | collapse |
| 06 | crashed by | 7,113 | 6,740 | 6,764 | 6,500 | 6,075 | 6,299 | 6,215 | 6,204 | 6,263 | 6,002 | 4,921 | 5,206 | 5,111 | 5,141 | 4,942 | 5,196 | 5,166 | 4,982 | 5,119 | 5,373 | 5,609 | 5,346 | crashed by |
| 07 | caught in/between | 24,813 | 24,595 | 23,450 | 22,150 | 21,795 | 21,441 | 20,293 | 20,043 | 19,375 | 18,439 | 15,514 | 15,843 | 15,851 | 15,802 | 15,276 | 15,238 | 14,513 | 14,136 | 14,529 | 14,585 | 14,592 | 13,602 | caught in/between |
| 08 | cut | 14,541 | 14,472 | 13,871 | 13,323 | 13,039 | 12,399 | 11,682 | 11,199 | 11,132 | 10,707 | 9,352 | 9,393 | 9,229 | 9,258 | 9,038 | 8,704 | 8,423 | 8,117 | 7,760 | 7,878 | 7,977 | 7,592 | cut |
| 09 | injury to the sole of the foot | 386 | 344 | 418 | 328 | 330 | 341 | 347 | 342 | 303 | 257 | 224 | 241 | 252 | 282 | 252 | 260 | 262 | 250 | 252 | 258 | 220 | 242 | injury to the sole of the foot |
| 10 | drown | 47 | 46 | 33 | 32 | 31 | 44 | 42 | 32 | 23 | 41 | 38 | 30 | 933 | 34 | 31 | 41 | 30 | 36 | 44 | 46 | 30 | 27 | drown |
| 11 | contact to high/low-temperature | 2,624 | 2,718 | 2,911 | 2,750 | 2,641 | 2,860 | 2,613 | 2,697 | 2,660 | 2,692 | 2,344 | 2,866 | 2,704 | 2,678 | 2,870 | 2,810 | 2,677 | 2,831 | 2,889 | 3,546 | 3,250 | 3,099 | contact to high/low-temperature |
| 12 | contact to harmful substance | 526 | 572 | 574 | 611 | 584 | 593 | 623 | 655 | 585 | 527 | 444 | 483 | 523 | 482 | 467 | 466 | 504 | 483 | 521 | 537 | 521 | 558 | contact to harmful substance |
| 13 | electric shock | 180 | 194 | 186 | 157 | 130 | 160 | 151 | 115 | 151 | 149 | 102 | 118 | 100 | 108 | 120 | 116 | 105 | 99 | 81 | 126 | 89 | 92 | electric shock |
| 14 | explosion | 165 | 156 | 139 | 119 | 156 | 123 | 121 | 100 | 146 | 119 | 81 | 93 | 69 | 107 | 78 | 93 | 56 | 58 | 67 | 64 | 66 | 64 | explosion |
| 15 | burst | 97 | 85 | 94 | 89 | 85 | 89 | 77 | 75 | 76 | 83 | 55 | 48 | 58 | 60 | 43 | 52 | 53 | 60 | 45 | 44 | 42 | 51 | burst |
| 16 | fire | 129 | 114 | 129 | 105 | 115 | 112 | 104 | 144 | 113 | 107 | 106 | 93 | 86 | 73 | 83 | 87 | 83 | 81 | 44 | 85 | 128 | 61 | fire |
| 17 | traffic accident (public road) | 8,315 | 8,397 | 8,457 | 8,326 | 8,396 | 8,265 | 9,787 | 9,805 | 9,298 | 8,795 | 8,217 | 8,500 | 8,172 | 8,352 | 8,312 | 8,266 | 8,013 | 8,125 | 7,885 | 7,889 | 7,350 | 6,863 | traffic accident (public road) |
| 18 | traffic accident (others) | 158 | 138 | 110 | 139 | 114 | 138 | 175 | 173 | 213 | 127 | 80 | 94 | 101 | 96 | 99 | 97 | 103 | 88 | 98 | 98 | 110 | 97 | traffic accident (others) |
| 19 | reaction to motion/improper motion | 11,699 | 11,440 | 12,089 | 11,621 | 12,180 | 12,093 | 12,824 | 13,576 | 14,427 | 14,615 | 13,127 | 13,694 | 14,108 | 14,191 | 13,914 | 14,191 | 14,420 | 15,081 | 16,177 | 16,958 | 17,709 | 19,121 | reaction to motion/improper motion |
| 90 | others | 1,068 | 1,224 | 1,083 | 1,061 | 1,158 | 1,230 | 1,302 | 1,385 | 1,457 | 1,417 | 1,348 | 1,249 | 1,791 | 1,269 | 1,229 | 1,231 | 1,394 | 1,256 | 1,291 | 1,445 | 1,501 | 7,620 | others |
| 99 | unclassifiable | 403 | 369 | 413 | 438 | 407 | 393 | 339 | 372 | 360 | 348 | 270 | 230 | 227 | 315 | 321 | 310 | 269 | 259 | 275 | 267 | 266 | 177 | unclassifiable |
| 00 | total | 141,055 | 139,974 | 140,149 | 132,339 | 132,936 | 132,248 | 133,050 | 134,298 | 131,478 | 129,026 | 114,152 | 116,733 | 119,622 | 119,576 | 118,157 | 119,535 | 116,311 | 117,910 | 120,460 | 127,329 | 125,611 | 131,156 | total |
Industrial accidents mean fatal and non-fatal injuries with work absence of 4 days and more. Data of 2011 year include Industrial accidents caused by Great East Japan Earthquake in 2011.
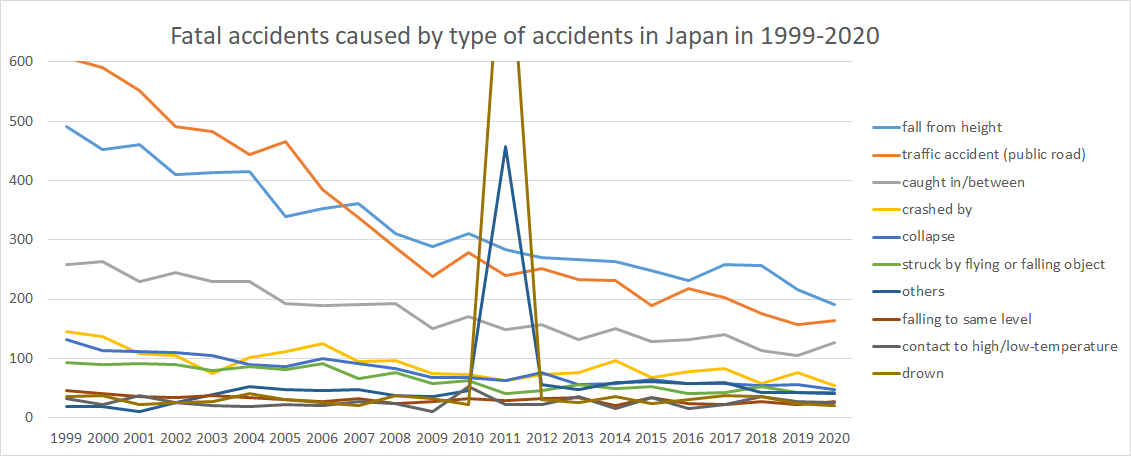
| code | Type of accidents | 1999 | 2000 | 2001 | 2002 | 2003 | 2004 | 2005 | 2006 | 2007 | 2008 | 2009 | 2010 | 2011 | 2012 | 2013 | 2014 | 2015 | 2016 | 2017 | 2018 | 2019 | 2020 | Type of accidents |
|---|---|---|---|---|---|---|---|---|---|---|---|---|---|---|---|---|---|---|---|---|---|---|---|---|
| 01 | fall from height | 492 | 453 | 461 | 411 | 413 | 415 | 339 | 353 | 361 | 311 | 289 | 311 | 284 | 271 | 266 | 263 | 248 | 232 | 258 | 256 | 216 | 191 | fall from height |
| 02 | falling to same level | 46 | 41 | 35 | 34 | 37 | 34 | 30 | 28 | 32 | 24 | 28 | 33 | 29 | 33 | 34 | 21 | 34 | 24 | 22 | 28 | 22 | 28 | falling to same level |
| 03 | crash | 14 | 7 | 8 | 4 | 15 | 8 | 10 | 10 | 6 | 11 | 9 | 5 | 7 | 3 | 8 | 5 | 7 | 3 | 3 | 3 | 2 | 11 | crash |
| 04 | struck by flying or falling object | 93 | 90 | 91 | 90 | 79 | 87 | 82 | 92 | 66 | 77 | 57 | 63 | 40 | 46 | 56 | 50 | 53 | 41 | 43 | 53 | 43 | 42 | struck by flying or falling object |
| 05 | collapse | 132 | 114 | 112 | 110 | 104 | 90 | 86 | 100 | 92 | 83 | 67 | 67 | 63 | 76 | 56 | 58 | 65 | 57 | 57 | 54 | 56 | 48 | collapse |
| 06 | crashed by | 145 | 137 | 108 | 104 | 74 | 102 | 111 | 125 | 94 | 96 | 74 | 73 | 62 | 72 | 76 | 97 | 67 | 78 | 83 | 58 | 77 | 54 | crashed by |
| 07 | caught in/between | 259 | 263 | 229 | 245 | 229 | 229 | 193 | 189 | 191 | 192 | 150 | 171 | 148 | 157 | 132 | 151 | 128 | 132 | 140 | 113 | 104 | 126 | caught in/between |
| 08 | cut | 5 | 9 | 7 | 8 | 11 | 7 | 8 | 4 | 6 | 6 | 4 | 8 | 6 | 8 | 5 | 4 | 2 | 0 | 0 | 5 | 4 | 6 | cut |
| 09 | injury to the sole of the foot | 2 | 0 | 1 | 3 | 2 | 2 | 1 | 2 | 3 | 0 | 0 | 2 | 1 | 0 | 0 | 2 | 0 | 2 | 0 | 0 | 0 | 0 | injury to the sole of the foot |
| 10 | drown | 35 | 37 | 22 | 26 | 27 | 40 | 31 | 26 | 20 | 38 | 33 | 23 | 911 | 31 | 25 | 35 | 24 | 31 | 38 | 35 | 24 | 21 | drown |
| 11 | contact to high/low-temperature | 33 | 23 | 37 | 26 | 20 | 18 | 23 | 20 | 28 | 24 | 10 | 53 | 22 | 23 | 35 | 15 | 34 | 16 | 22 | 36 | 27 | 26 | contact to high/low-temperature |
| 12 | contact to harmful substance | 25 | 30 | 21 | 32 | 24 | 19 | 17 | 29 | 15 | 20 | 20 | 20 | 20 | 17 | 18 | 17 | 22 | 9 | 13 | 17 | 14 | 21 | contact to harmful substance |
| 13 | electric shock | 33 | 34 | 30 | 16 | 14 | 23 | 28 | 19 | 14 | 21 | 14 | 13 | 12 | 15 | 5 | 15 | 11 | 11 | 9 | 13 | 3 | 6 | electric shock |
| 14 | explosion | 14 | 7 | 7 | 5 | 21 | 15 | 7 | 3 | 13 | 9 | 9 | 5 | 6 | 13 | 12 | 12 | 2 | 3 | 6 | 7 | 4 | 4 | explosion |
| 15 | burst | 6 | 3 | 5 | 1 | 0 | 6 | 5 | 3 | 0 | 5 | 1 | 3 | 1 | 3 | 2 | 4 | 1 | 6 | 1 | 1 | 0 | 2 | burst |
| 16 | fire | 11 | 20 | 40 | 4 | 22 | 6 | 6 | 22 | 14 | 9 | 18 | 5 | 9 | 7 | 9 | 9 | 13 | 3 | 5 | 6 | 45 | 6 | fire |
| 17 | traffic accident (public road) | 608 | 590 | 552 | 492 | 482 | 444 | 466 | 385 | 337 | 287 | 238 | 278 | 240 | 251 | 233 | 232 | 189 | 218 | 202 | 175 | 157 | 164 | traffic accident (public road) |
| 18 | traffic accident (others) | 16 | 11 | 11 | 16 | 10 | 18 | 16 | 14 | 14 | 10 | 9 | 12 | 12 | 6 | 3 | 4 | 3 | 1 | 12 | 3 | 3 | 5 | traffic accident (others) |
| 19 | reaction to motion/improper motion | 0 | 0 | 0 | 0 | 0 | 0 | 0 | 0 | 0 | 0 | 0 | 0 | 0 | 0 | 1 | 0 | 0 | 1 | 0 | 0 | 0 | 0 | reaction to motion/improper motion |
| 90 | others | 18 | 18 | 10 | 25 | 39 | 52 | 47 | 45 | 47 | 38 | 36 | 46 | 458 | 56 | 47 | 59 | 61 | 58 | 60 | 43 | 42 | 41 | others |
| 99 | unclassifiable | 5 | 2 | 3 | 6 | 5 | 5 | 8 | 3 | 4 | 7 | 9 | 4 | 7 | 5 | 7 | 4 | 8 | 2 | 4 | 3 | 2 | 0 | unclassifiable |
| 00 | total | 1,992 | 1,889 | 1,790 | 1,658 | 1,628 | 1,620 | 1,514 | 1,472 | 1,357 | 1,268 | 1,075 | 1,195 | 2,338 | 1,093 | 1,030 | 1,057 | 972 | 928 | 978 | 909 | 845 | 802 | total |
Data sources: https://anzeninfo.mhlw.go.jp/user/anzen/tok/anst00.htm (MHLW, Japan)
(Ref.)
全ての働く人々に安全・健康を 〜Safe Work , Safe Life〜
中央労働災害防止協会
〒108-0014 東京都港区芝5-35-2 安全衛生総合会館
COPYRIGHT © JISHA. ALLRIGHTS RESERVED.


