![]()
![]()
![]()
The information collected by the  JICOSH
  ,
the former international center of JISHA, is available here, though it has not been updated:
,
the former international center of JISHA, is available here, though it has not been updated:
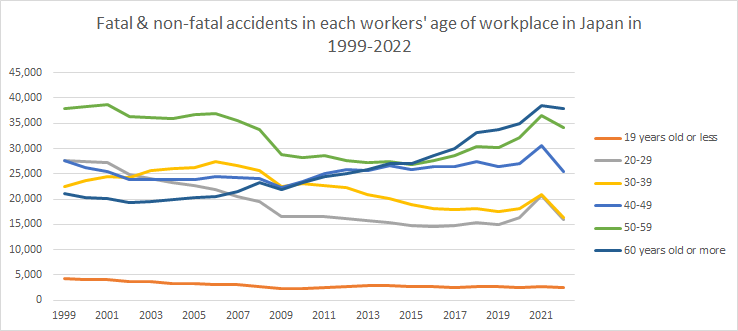
 Fatal & non-fatal accidents in each workers' age of workplace in Japan in 1999-2022
 | workers' age | 1999 | 2000 | 2001 | 2002 | 2003 | 2004 | 2005 | 2006 | 2007 | 2008 | 2009 | 2010 | 2011 | 2012 | 2013 | 2014 | 2015 | 2016 | 2017 | 2018 | 2019 | 2020 | 2021 | 2022 | total | workers' age |
|---|---|---|---|---|---|---|---|---|---|---|---|---|---|---|---|---|---|---|---|---|---|---|---|---|---|---|
| 19 years old or less | 4,247 | 4,133 | 4,074 | 3,756 | 3,719 | 3,372 | 3,363 | 3,134 | 2,999 | 2,765 | 2,215 | 2,357 | 2,401 | 2,670 | 2,839 | 2,811 | 2,763 | 2,607 | 2,533 | 2,722 | 2,680 | 2,527 | 2,611 | 2,460 | 71,758 | 19 years old or less |
| 20-29 | 27,565 | 27,372 | 27,315 | 24,942 | 24,031 | 23,272 | 22,642 | 21,909 | 20,546 | 19,506 | 16,473 | 16,542 | 16,489 | 16,113 | 15,686 | 15,395 | 14,784 | 14,526 | 14,770 | 15,288 | 15,025 | 16,410 | 20,712 | 15,937 | 463,250 | 20-29 |
| 30-39 | 22,539 | 23,701 | 24,410 | 24,178 | 25,657 | 26,011 | 26,266 | 27,393 | 26,705 | 25,658 | 22,545 | 23,017 | 22,587 | 22,293 | 20,973 | 20,051 | 18,879 | 18,166 | 18,001 | 18,199 | 17,434 | 18,082 | 20,938 | 16,412 | 530,095 | 30-39 |
| 40-49 | 27,633 | 26,144 | 25,536 | 23,926 | 23,896 | 23,771 | 23,848 | 24,416 | 24,353 | 24,049 | 22,318 | 23,414 | 24,984 | 25,771 | 25,724 | 26,653 | 25,913 | 26,403 | 26,498 | 27,489 | 26,463 | 27,089 | 30,507 | 25,441 | 612,239 | 40-49 |
| 50-59 | 38,017 | 38,270 | 38,645 | 36,284 | 36,181 | 36,013 | 36,671 | 36,989 | 35,479 | 33,764 | 28,783 | 28,178 | 28,610 | 27,591 | 27,167 | 27,523 | 26,875 | 27,603 | 28,631 | 30,385 | 30,294 | 32,120 | 36,576 | 34,117 | 780,766 | 50-59 |
| 60 years old or more | 21,054 | 20,354 | 20,169 | 19,253 | 19,452 | 19,809 | 20,260 | 20,457 | 21,396 | 23,284 | 21,818 | 23,225 | 24,551 | 25,138 | 25,768 | 27,102 | 27,097 | 28,605 | 30,027 | 33,246 | 33,715 | 34,928 | 38,574 | 37,988 | 617,270 | 60 years old or more |
| total | 141,055 | 139,974 | 140,149 | 132,339 | 132,936 | 132,248 | 133,050 | 134,298 | 131,478 | 129,026 | 114,152 | 116,733 | 119,622 | 119,576 | 118,157 | 119,535 | 116,311 | 117,910 | 120,460 | 127,329 | 125,611 | 131,156 | 149,918 | 132,355 | 3,075,378 | total |
Fatal and non-fatal accidents mean fatal and non-fatal injuries and occupational diseases with work absence of 4 days and more.
Data of 2022 year do not include Covid-19 cases. Data of 2020 & 2021 year include Covid-19 cases. Fatal and non-fatal data are same situation.
Data of 2011 year include fatal and non-fatal accidents caused by Great East Japan Earthquake in 2011.
| workers' age | 1999 | 2000 | 2001 | 2002 | 2003 | 2004 | 2005 | 2006 | 2007 | 2008 | 2009 | 2010 | 2011 | 2012 | 2013 | 2014 | 2015 | 2016 | 2017 | 2018 | 2019 | 2020 | 2021 | 2022 | total | workers' age |
|---|---|---|---|---|---|---|---|---|---|---|---|---|---|---|---|---|---|---|---|---|---|---|---|---|---|---|
| 19 years old or less | 35 | 30 | 38 | 21 | 25 | 25 | 27 | 21 | 12 | 15 | 14 | 19 | 24 | 15 | 19 | 21 | 11 | 7 | 13 | 11 | 4 | 10 | 2 | 9 | 428 | 19 years old or less |
| 20-29 | 309 | 270 | 284 | 232 | 208 | 181 | 174 | 177 | 147 | 122 | 119 | 127 | 203 | 88 | 97 | 111 | 88 | 95 | 89 | 78 | 82 | 65 | 67 | 72 | 3,485 | 20-29 |
| 30-39 | 240 | 271 | 267 | 244 | 233 | 276 | 224 | 235 | 217 | 191 | 146 | 187 | 373 | 176 | 137 | 141 | 122 | 128 | 100 | 99 | 95 | 93 | 72 | 61 | 4,328 | 30-39 |
| 40-49 | 371 | 333 | 293 | 281 | 273 | 243 | 259 | 223 | 202 | 216 | 187 | 196 | 474 | 207 | 192 | 202 | 177 | 181 | 213 | 176 | 174 | 130 | 142 | 121 | 5,466 | 40-49 |
| 50-59 | 545 | 513 | 501 | 484 | 500 | 488 | 464 | 452 | 400 | 336 | 283 | 301 | 660 | 275 | 218 | 230 | 247 | 224 | 235 | 202 | 184 | 186 | 216 | 175 | 8,319 | 50-59 |
| 60 years old or more | 492 | 472 | 407 | 396 | 389 | 407 | 366 | 364 | 379 | 388 | 326 | 365 | 604 | 332 | 367 | 352 | 327 | 293 | 328 | 343 | 306 | 318 | 368 | 336 | 9,025 | 60 years old or more |
| total | 1,992 | 1,889 | 1,790 | 1,658 | 1,628 | 1,620 | 1,514 | 1,472 | 1,357 | 1,268 | 1,075 | 1,195 | 2,338 | 1,093 | 1,030 | 1,057 | 972 | 928 | 978 | 909 | 845 | 802 | 867 | 774 | 31,051 | total |
Data sources: https://anzeninfo.mhlw.go.jp/user/anzen/tok/anst00.htm (MHLW, Japan)

Reference:
全ての働く人々に安全・健康を 〜Safe Work , Safe Life〜
中央労働災害防止協会
〒108-0014 東京都港区芝5-35-2 安全衛生総合会館
COPYRIGHT © JISHA. ALLRIGHTS RESERVED.


