![]()
![]()
![]()
The information collected by the  JICOSH
  ,
the former international center of JISHA, is available here, though it has not been updated:
,
the former international center of JISHA, is available here, though it has not been updated:
 Annual occupational accident rate by years of experience in construction industry in 2017 in Japan (Relative rate by years of experience when the annual accident rate for 1 to 2 years experience is set to 1 )
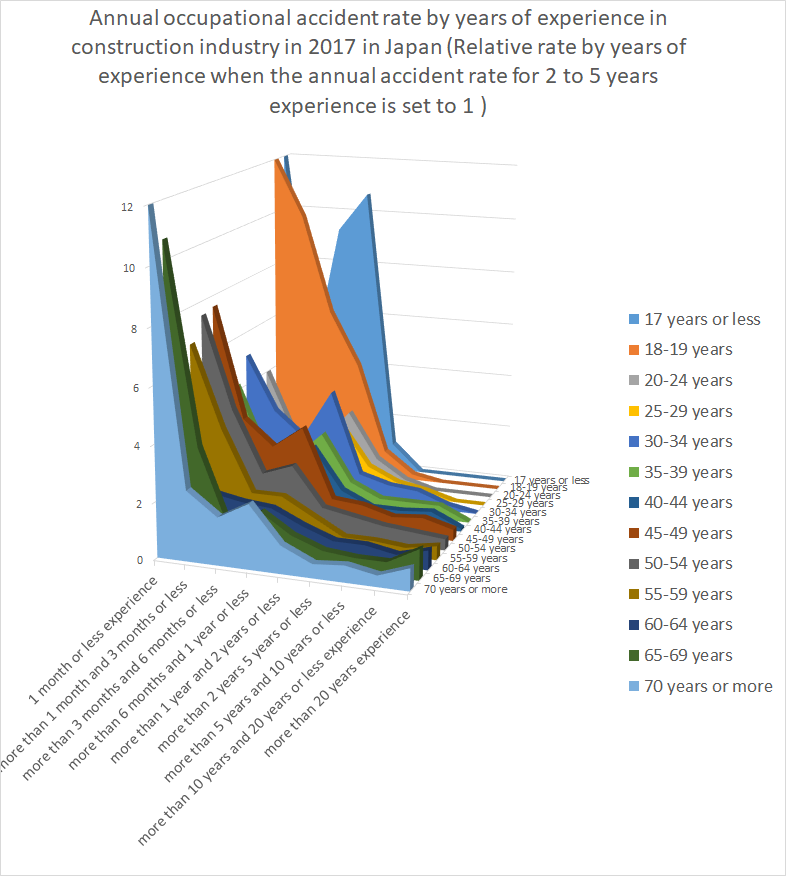
| experience | total | 1 month or less experience | more than 1 month and 3 months or less | more than 3 months and 6 months or less | more than 6 months and 1 year or less | more than 1 year and 2 years or less | more than 2 years 5 years or less | more than 5 years and 10 years or less | more than 10 years and 20 years or less | more than 20 years experience |
|---|---|---|---|---|---|---|---|---|---|---|
| total | 6,355 | 202 | 199 | 205 | 613 | 456 | 911 | 831 | 1,170 | 1,768 |
| 17 years or less | 31 | 3 | 2 | 7 | 16 | 3 | 0 | 0 | 0 | 0 |
| 18-19 years | 114 | 14 | 23 | 22 | 30 | 14 | 9 | 1 | 0 | 1 |
| 20-24 years | 511 | 36 | 28 | 41 | 144 | 107 | 142 | 11 | 0 | 2 |
| 25-29 years | 500 | 14 | 31 | 21 | 93 | 75 | 139 | 121 | 6 | 0 |
| 30-34 years | 450 | 15 | 18 | 19 | 70 | 35 | 99 | 109 | 85 | 0 |
| 35-39 years | 580 | 16 | 13 | 19 | 62 | 46 | 83 | 120 | 211 | 10 |
| 40-44 years | 662 | 19 | 10 | 15 | 52 | 41 | 82 | 99 | 233 | 111 |
| 45-49 years | 708 | 17 | 16 | 18 | 47 | 27 | 97 | 80 | 182 | 224 |
| 50-54 years | 549 | 15 | 17 | 12 | 29 | 24 | 72 | 71 | 118 | 191 |
| 55-59 years | 561 | 15 | 17 | 11 | 21 | 27 | 48 | 60 | 94 | 268 |
| 60-64 years | 696 | 10 | 8 | 11 | 20 | 27 | 70 | 77 | 105 | 368 |
| 65-69 years | 643 | 16 | 11 | 4 | 15 | 18 | 46 | 49 | 82 | 402 |
| 70 years or more | 349 | 12 | 5 | 5 | 14 | 12 | 24 | 33 | 54 | 190 |
| Unclassifiable | 1 | 0 | 0 | 0 | 0 | 0 | 0 | 0 | 0 | 1 |
 https://anzeninfo.mhlw.go.jp/user/anzen/tok/link/tok1-702-2.xlsx(MHLW, Japan)
| experience | 1 month or less experience | more than 1 month and 3 months or less | more than 3 months and 6 months or less | more than 6 months and 1 year or less | more than 1 year and 2 years or less | more than 2 years 5 years or less | more than 5 years and 10 years or less | more than 10 years and 20 years or less | more than 20 years experience |
|---|---|---|---|---|---|---|---|---|---|
| conversion factor for annual rate | 12 | 6 | 4 | 2 | 1 | 0.25 | 0.2 | 0.1 | 0.05 |
| 17 years or less | 12 | 4 | 9.3 | 10.7 | 1 | 0 | 0 | 0 | 0 |
| 18-19 years | 12 | 9.9 | 6.3 | 4.3 | 1 | 0.2 | 0 | 0 | 0 |
| 20-24 years | 4 | 1.6 | 1.5 | 2.7 | 1 | 0.3 | 0 | 0 | 0 |
| 25-29 years | 2.2 | 2.5 | 1.1 | 2.5 | 1 | 0.5 | 0.3 | 0 | 0 |
| 30-34 years | 5.1 | 3.1 | 2.2 | 4 | 1 | 0.7 | 0.6 | 0.2 | 0 |
| 35-39 years | 4.2 | 1.7 | 1.7 | 2.7 | 1 | 0.5 | 0.5 | 0.5 | 0 |
| 40-44 years | 5.6 | 1.5 | 1.5 | 2.5 | 1 | 0.5 | 0.5 | 0.6 | 0.1 |
| 45-49 years | 7.6 | 3.6 | 2.7 | 3.5 | 1 | 0.9 | 0.6 | 0.7 | 0.4 |
| 50-54 years | 7.5 | 4.2 | 2 | 2.4 | 1 | 0.8 | 0.6 | 0.5 | 0.4 |
| 55-59 years | 6.7 | 3.8 | 1.6 | 1.6 | 1 | 0.4 | 0.4 | 0.3 | 0.5 |
| 60-64 years | 4.4 | 1.8 | 1.6 | 1.5 | 1 | 0.6 | 0.6 | 0.4 | 0.7 |
| 65-69 years | 10.7 | 3.7 | 0.9 | 1.7 | 1 | 0.6 | 0.5 | 0.5 | 1.1 |
| 70 years or more | 12 | 2.5 | 1.7 | 2.3 | 1 | 0.5 | 0.6 | 0.4 | 0.8 |
全ての働く人々に安全・健康を 〜Safe Work , Safe Life〜
中央労働災害防止協会
〒108-0014 東京都港区芝5-35-2 安全衛生総合会館
COPYRIGHT © JISHA. ALLRIGHTS RESERVED.


