![]()
![]()
![]()
The information collected by the  JICOSH
  ,
the former international center of JISHA, is available here, though it has not been updated:
,
the former international center of JISHA, is available here, though it has not been updated:
 Annual occupational accident rate by years of experience in each large industry in Japan in 2022
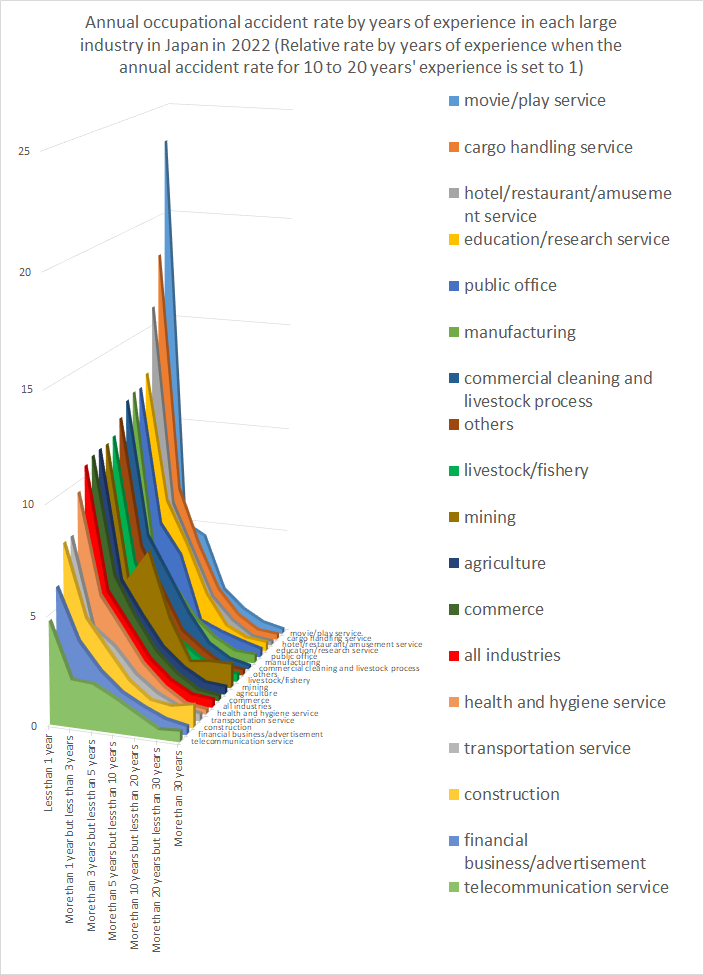
| 1 | 2 | 3 | 4 | 5 | 6 | 7 | |||
|---|---|---|---|---|---|---|---|---|---|
| Years of experience | Less than 1 year | More than 1 year but less than 3 years | More than 3 years but less than 5 years | More than 5 years but less than 10 years | More than 10 years but less than 20 years | More than 20 years but less than 30 years | More than 30 years | total | |
| 1 | manufacturing | 5,898 | 4,386 | 3,120 | 4,450 | 4,764 | 2,182 | 1,894 | 26,694 |
| 2 | mining | 27 | 23 | 30 | 37 | 25 | 28 | 28 | 198 |
| 3 | construction | 1,848 | 2,108 | 1,474 | 2,133 | 2,391 | 2,043 | 2,542 | 14,539 |
| 4 | transportation service | 2,856 | 2,724 | 2,154 | 3,227 | 3,679 | 1,902 | 1,193 | 17,735 |
| 5 | cargo handling service | 566 | 433 | 267 | 338 | 312 | 109 | 77 | 2,102 |
| 6 | agriculture | 528 | 467 | 317 | 452 | 489 | 213 | 171 | 2,637 |
| 7 | livestock/fishery | 345 | 322 | 183 | 282 | 315 | 141 | 113 | 1,701 |
| 8 | commerce | 4,324 | 4,270 | 2,782 | 3,931 | 4,035 | 1,475 | 885 | 21,702 |
| 9 | financial business/advertisement | 151 | 183 | 121 | 193 | 252 | 143 | 95 | 1,138 |
| 10 | movie/play service | 42 | 18 | 16 | 17 | 18 | 8 | 4 | 123 |
| 11 | telecommunication service | 267 | 245 | 236 | 446 | 564 | 241 | 275 | 2,274 |
| 12 | education/research service | 273 | 290 | 204 | 261 | 212 | 112 | 89 | 1,441 |
| 13 | health and hygiene service | 3,170 | 3,257 | 2,307 | 3,299 | 3,331 | 1,182 | 691 | 17,237 |
| 14 | hotel/restaurant/amusement service | 2,313 | 1,885 | 1,245 | 1,498 | 1,460 | 470 | 269 | 9,140 |
| 15 | commercial cleaning and livestock process | 1,417 | 1,365 | 960 | 1,372 | 1,162 | 440 | 173 | 6,889 |
| 16 | public office | 26 | 25 | 19 | 15 | 21 | 14 | 8 | 128 |
| 17 | others | 1,402 | 1,355 | 893 | 1,086 | 1,210 | 426 | 305 | 6,677 |
| 0 | all industries | 25,453 | 23,356 | 16,328 | 23,037 | 24,240 | 11,129 | 8,812 | 132,355 |
Data source: https://anzeninfo.mhlw.go.jp/user/anzen/tok/anst00.html(Japanese language)
All data of fatal & non-fatal accidents in Japan in 2022
Annual occupational accident rate by years of experience in each large industry in Japan in 2022 (Relative rate by years of experience when the annual accident rate for 10 to 20 years' experience is set to 1)
| Years of experience | Less than 1 year | More than 1 year but less than 3 years | More than 3 years but less than 5 years | More than 5 years but less than 10 years | More than 10 years but less than 20 years | More than 20 years but less than 30 years | More than 30 years | |
|---|---|---|---|---|---|---|---|---|
| factor for annual rate | 1 | 2 | 2 | 5 | 10 | 10 | 10 | |
| 1 | manufacturing | 12.38 | 4.6 | 3.27 | 1.87 | 1 | 0.46 | 0.4 |
| 2 | mining | 10.8 | 4.6 | 6 | 2.96 | 1 | 1.12 | 1.12 |
| 3 | construction | 7.73 | 4.41 | 3.08 | 1.78 | 1 | 0.85 | 1.06 |
| 4 | transportation service | 7.76 | 3.7 | 2.93 | 1.75 | 1 | 0.52 | 0.32 |
| 5 | cargo handling service | 18.14 | 6.94 | 4.28 | 2.17 | 1 | 0.35 | 0.25 |
| 6 | agriculture | 10.8 | 4.78 | 3.24 | 1.85 | 1 | 0.44 | 0.35 |
| 7 | livestock/fishery | 10.95 | 5.11 | 2.9 | 1.79 | 1 | 0.45 | 0.36 |
| 8 | commerce | 10.72 | 5.29 | 3.45 | 1.95 | 1 | 0.37 | 0.22 |
| 9 | financial business/advertisement | 5.99 | 3.63 | 2.4 | 1.53 | 1 | 0.57 | 0.38 |
| 10 | movie/play service | 23.33 | 5 | 4.44 | 1.89 | 1 | 0.44 | 0.22 |
| 11 | telecommunication service | 4.73 | 2.17 | 2.09 | 1.58 | 1 | 0.43 | 0.49 |
| 12 | education/research service | 12.88 | 6.84 | 4.81 | 2.46 | 1 | 0.53 | 0.42 |
| 13 | health and hygiene service | 9.52 | 4.89 | 3.46 | 1.98 | 1 | 0.35 | 0.21 |
| 14 | hotel/restaurant/amusement service | 15.84 | 6.46 | 4.26 | 2.05 | 1 | 0.32 | 0.18 |
| 15 | commercial cleaning and livestock process | 12.19 | 5.87 | 4.13 | 2.36 | 1 | 0.38 | 0.15 |
| 16 | public office | 12.38 | 5.95 | 4.52 | 1.43 | 1 | 0.67 | 0.38 |
| 17 | others | 11.59 | 5.6 | 3.69 | 1.8 | 1 | 0.35 | 0.25 |
| 0 | all industries | 10.5 | 4.82 | 3.37 | 1.9 | 1 | 0.46 | 0.36 |
全ての働く人々に安全・健康を 〜Safe Work , Safe Life〜
中央労働災害防止協会
〒108-0014 東京都港区芝5-35-2 安全衛生総合会館
COPYRIGHT © JISHA. ALLRIGHTS RESERVED.


