Fig.1 Change in number of deaths in all industries (1989–2010)
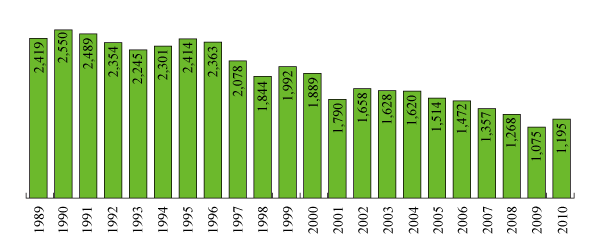
Source:
Number of deaths: Survey by the Safety Division‚ Ministry of Health‚ Labour and Welfare (MHLW)
Fig.2 Change in number of deaths & injuries with work absence of 4 days or more in all industries (1989–2010)
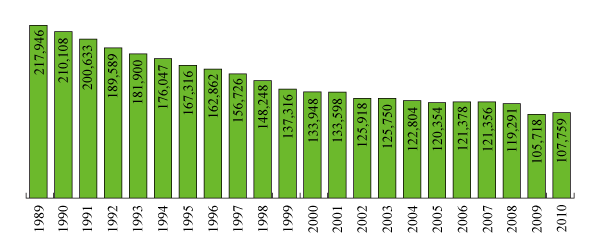
Source:
Number of deaths and injuries: Data on workers' accident compensation insurance benefits‚ MHLW
Fig.3 Change in number of new recipients of workers' accident compensation insurance benefits (1989–2009)
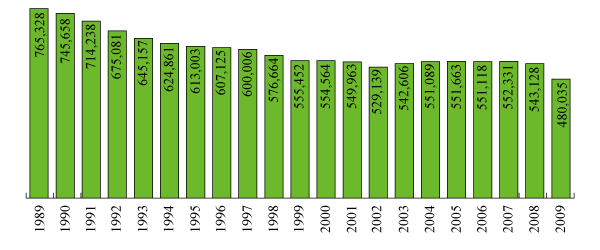
Source:
Number of new recipients of workers' accident compensation insurance benefits: Annual report on Workers' Accident Compensation Insurance Programme
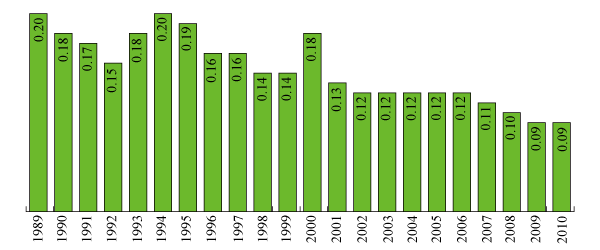
Fig.4 Change in frequency rate in all industries (1989–2010)
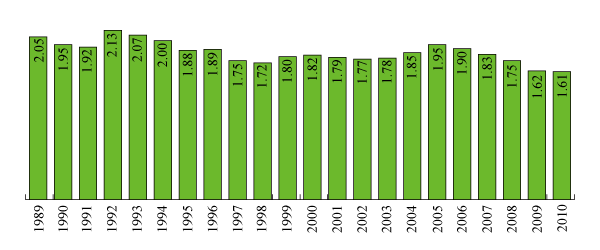
Definition:
Frequency rate is expressed in terms of numbers of deaths & injuries in industrial accidents per 1 million work-hours in the aggregate.
Source:
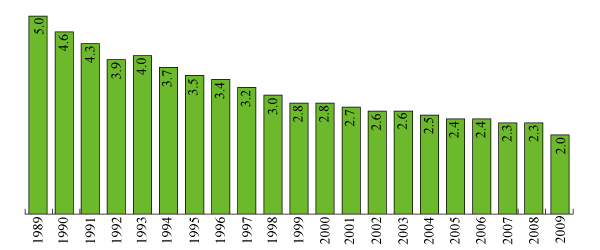
Frequency rate and severity rate: Industrial accident census‚ MHLW
Fig.5 Change in severity rate in all industries (1989–2010)
Definition:
Severity rate is expressed in terms of the number of workdays lost per 1,000 work-hours in the aggregate.
Fig.6 Change in accident rate per 1‚000 workers in all industries (1989–2009)
Source:
Accident rate per 1‚000 workers: Annual report on Workers' Accident Compensation Insurance Programme and Data on workers' accident compensation insurance benefits‚ MHLW
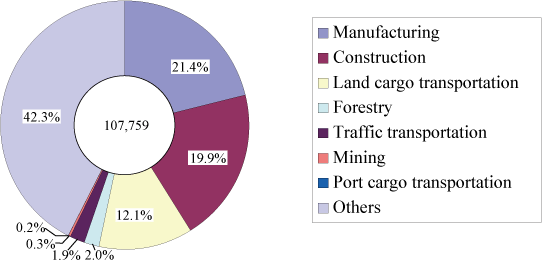
Fig.7 Number of deaths & injuries with work absence of 4 days or more by industrial sector(2010)
Source:
Data on workers' accident compensation insurance benefits‚ MHLW
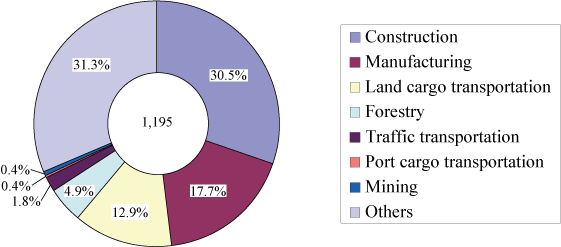
Fig.8 Number of deaths by industrial sector (2010)
Source:
Survey by the Safety Division‚ MHLW
Fig.9 Breakdown of deaths & injuries with work absence of 4 days or more by accident type in all industries(2010)
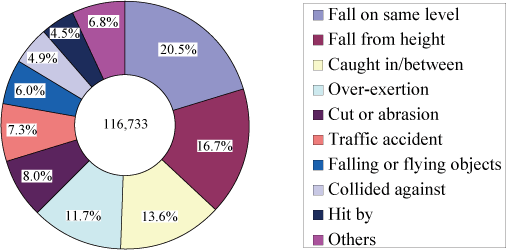
Source:
Data on the report of death‚ injury and disease based on the Industrial Safety and Health Act
Fig.10 Breakdown of deaths by accident type in all industries(2010)
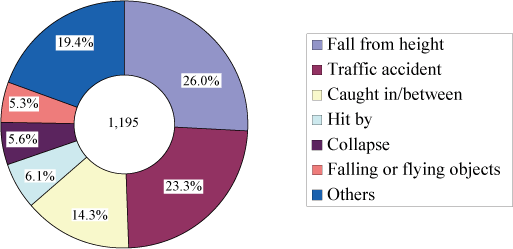
Source:
Number of deaths: Survey by the Safety Division‚ MHLW
Fig.11 Breakdown of deaths & injuries with work absence of 4 days or more by cause agents in all industries(2010)
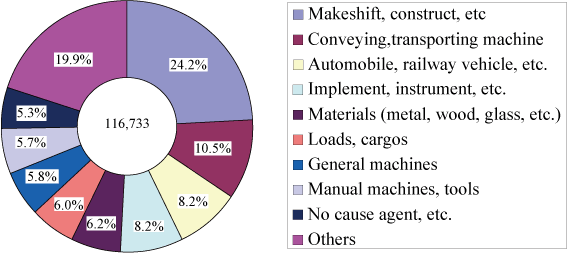
Source:
Data on the report of death‚ injury and disease based on the Industrial Safety and Health Act
Fig.12 Breakdown of deaths by cause agents in all industries(2010)
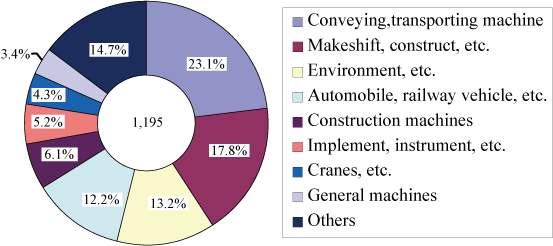
Source:
Number of deaths: Survey by the Safety Division‚ MHLW
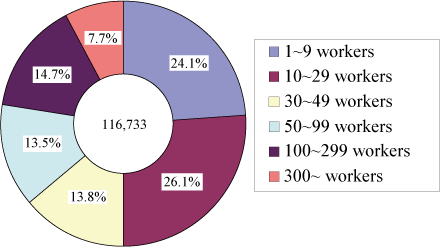
Fig.13 Deaths & injuries with work absence of 4 days or more by workplace size (2010)
Source:
Data on the report of death‚ injury and disease based on the Industrial Safety and Health Act
Fig.14 Accident rate per 1‚000 workers by workplace size(2009)

Source:
Calculated from Data on Survey report on business statistics (Ministry of Internal Affairs and Communications) and data on reportable accidents
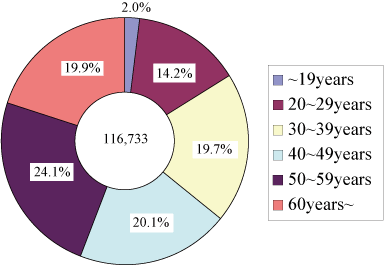
Fig.15 Deaths & injuries with work absence of 4 days or more by age group (2010)
Source:
Data on the report of death‚ injury and disease based on the Industrial Safety and Health Act
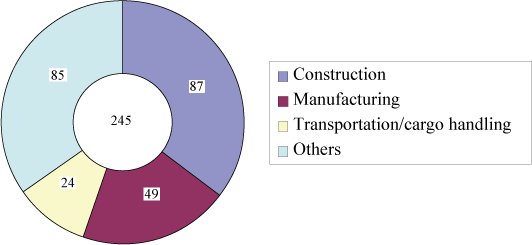
Fig.16 Serious accidents by industrial sector(2010)
Definition:
Serious accident signifies an accident resulting in three or more deaths and/or injuries at a time.
Source:
Survey by the Safety Division‚ MHLW
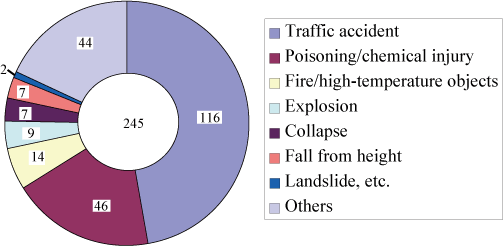
Fig.17 Serious accidents by accident causes(2010)
Source:
Survey by the Safety Division‚ MHLW